FeralWebbings
Blogpost : https://blog.illestpreacha.com/mathober2024spidergraph
#mathober curated by
@fractalkitty
#mathart #mathober2024 #mathober24 #spidergraph
Coded #hydravideosynth
Graphs with #rawgraphs
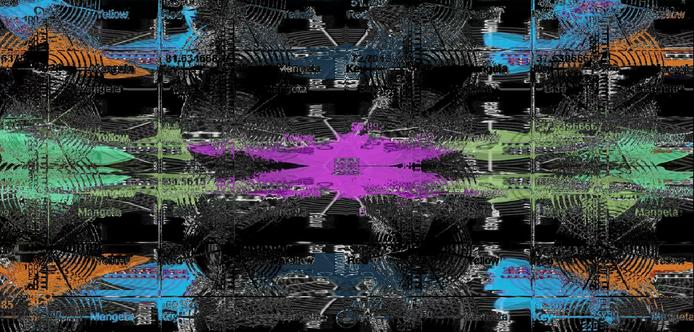
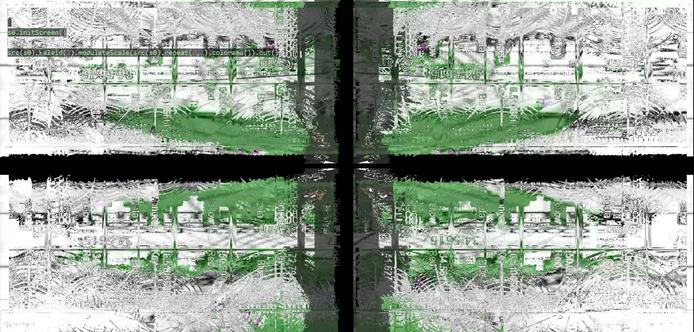
For the 20th sketch of Mathober2024, FeralWebbing is coded in Hydra with a Spider Graph (24th Prompt of Matohober2024) with Rawgraphs.
Webbings Overlapping
Circular fields snapping
Eclipsing
Shadows Dipping
Light sources Slipping
Webbings persisting
#creativecoding #coding #mathart #graphing
#livecoding #animation #dataart

Mathober2024_SpiderGraph
FeralWebbing For the 20th sketch of Mathober2024, FeralWebbing is coded in Hydra with a Spider Graph (24th Prompt of Matohober2024) with Rawgraphs. Poem Webbings Overlapping Circular fields snapping Eclipsing Shadows Dipping Light sources Slipping We...