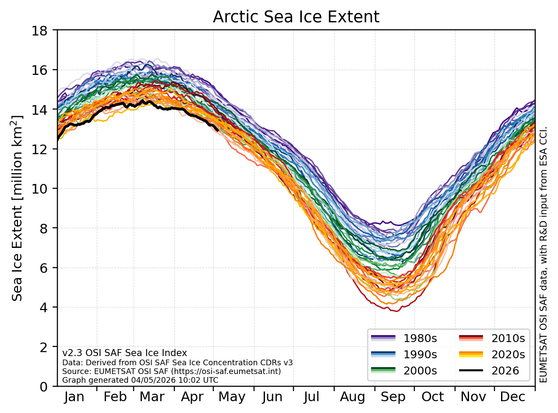
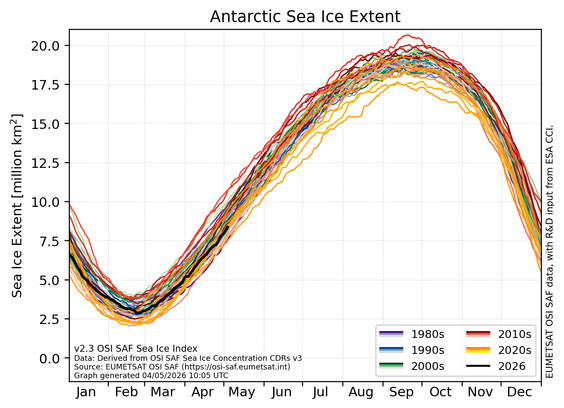
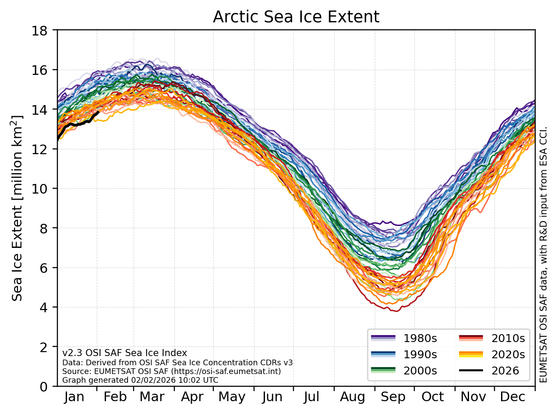
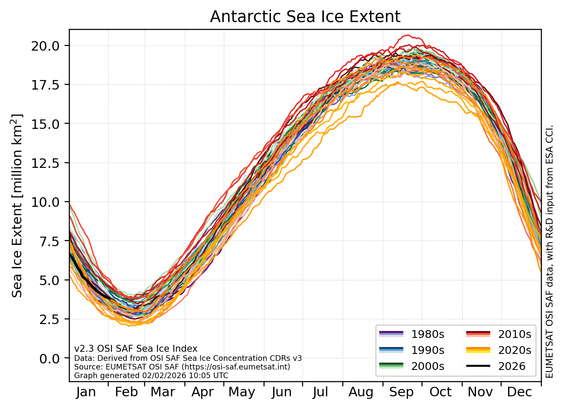
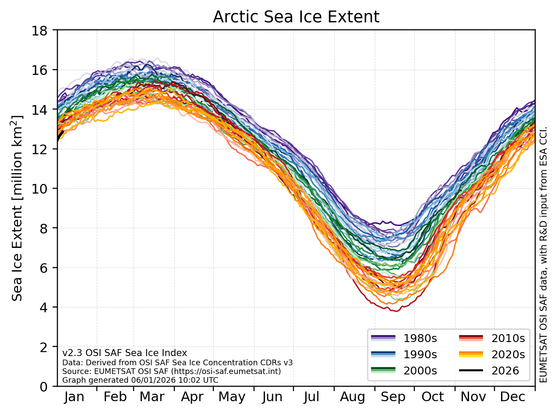
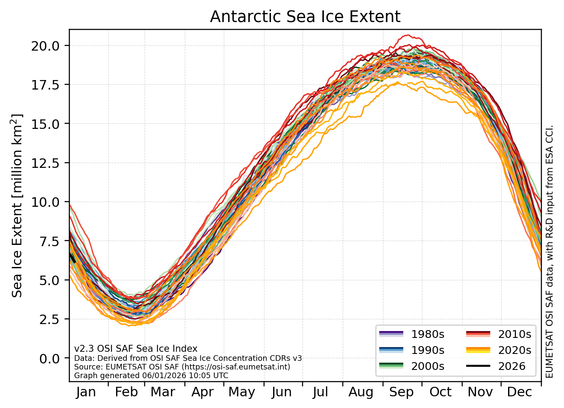
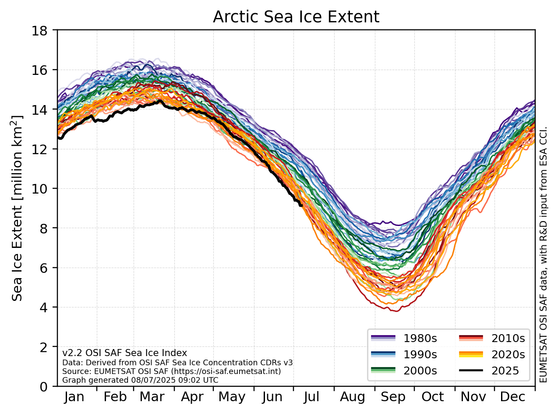
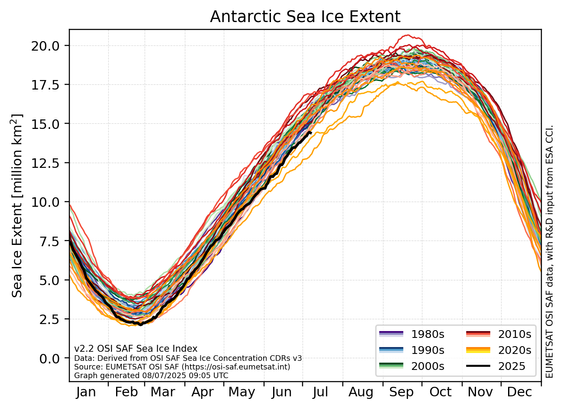
In february 2026, the #SeaIce global extent was 4.5% below 1991-2020 mean. Since the beginning of records (1978):
- #Arctic, 3rd lowest monthly mean, with 4.8% less extent than normal (-712,597km²)
- #Antarctic, 26th lowest monthly mean, with 3.1% less extent than normal (-105,212km²)

for more: https://osi-saf.eumetsat.int/sea-ice-index
#ClimateChange #OSISAF @eumetsat

In January 2026, the #SeaIce global extent was 6.7% below/over 1991-2020 mean. Since the begining of records (1978):
- #Arctic, 3rd lowest monthly mean, with 5.5% less extent than normal (-769,999km²)
- #Antarctic, 18th lowest monthly mean, with 8.3% less exent than normal (-451,325km²)

for more: https://osi-saf.eumetsat.int/sea-ice-index

#ClimateChange #OSISAF @eumetsat

In December 2025, the #SeaIce global extent was 9% below 1991-2020 mean. Since the beginning of records (november 1978):
- #Arctic, 1st lowest monthly mean, with 9% less extent than normal (-1,090,481km²)
- #Antarctic, 7th lowest monthly mean, with 10% less exent than normal (-1,090,481 km²)
more: https://osi-saf.eumetsat.int/sea-ice-index

#ClimateChange #OSISAF @eumetsat

In November 2025, the #SeaIce global extent was 8.7% below 1991-2020 mean. Since the beginning of records (1978):
- #Arctic, 2nd lowest monthly mean, with 11.7% less extent than normal (-1,198,440km²)
- #Antarctic, 4th lowest monthly mean, with 7.3% less extent than normal (-1,188,737 km²)
more: https://osi-saf.eumetsat.int/sea-ice-index
#ClimateChange #OSISAF @eumetsat

In August 2025, the #SeaIce global extent was 8.4% below 1991-2020 mean. Since the beginning of records (November 1978):
- #Arctic, 8th lowest monthly mean, with 12,2% less extent than normal (-823 904km²)
- #Antarctic, 3rd lowest monthly mean, with 6.9% less exent than normal (-1 264 062km²)

for more: https://osisaf-hl.met.no/v2p3-sea-ice-index

#ClimateChange #OSISAF @eumetsat

Like for the MSG product, the MTG product is a level 3, hourly, sub-skin Sea Surface Temperature derived from Meteosat at 0° longitude, covering 60S-60N and 60W-60E and re-projected on a 0.05° regular grid, in GHRSST compliant netCDF format.

#OSISAF @eumetsat #GHRSST

The MTG product benefits from the higher temporal and spatial resolution of MTG, but the output files have the same temporal and spatial sampling as the MSG product.

In July 2025, the #SeaIce global extent was 8.9% below 1991-2020 mean. Since the beginning of records (1978):
- #Arctic, 4th lowest monthly mean, with 9.9% less extent than normal (-906.931 km²)
- #Antarctic, 3rd lowest monthly mean, with 8.3% less exent than normal (-1.363.243 km²)
For more: https://osisaf-hl.met.no/v2p2-sea-ice-index
#ClimateChange #OSISAF @eumetsat

In June 2025, the #SeaIce global extent was 7.9% below 1991-2020 mean. Since the begining of record (november 1978):
- #Arctic, 2th lowest June monthly mean, with 6.4% less extent than normal (-733 404km²)
- #Antarctic, 3th lowest June monthly mean, with 9.1% less exent than normal (-1 255 507km²)

for more: https://osisaf-hl.met.no/v2p2-sea-ice-index

#ClimateChange #OSISAF

We have never measured so little #SeaIce around #Svalbard #Norway in mid November.

The #OSISAF satellite-based timeseries goes back to the late 1970s.

-> https://cryo.met.no/en/sea-ice-index-sval

Sea Ice Index - Svalbard | cryo.met.no

Svalbard region Svalbard region: 72-85oN latitude, 0-40oE longitude. Background ice field: mean March 1981-2010.

What an almost pleasant behavior of the global sea-ice extent
- almost reaching the bottom line (=previous minimum extents) from below.

Source: #OSISAF