And here are the individual terms (not summed). The colors are still related to those in the previous toot, but I mixed in a little bit of black to ensure a reasonable amount of contrast with the white background.

On the left: each monomial of the decomposition.
On the right: same, but divided by the exponential function again.

#manim #MadeWithManim #mathematics #math #dataviz

As a follow-up to yesterday's post, here's the same visualization, but with everything normalized, i.e. divided by the exponential function. I haven't included the reversed version (with low-order terms at the top) this time, because now it would just amount to flipping the figure upside down.

#manim #MadeWithManim #MathVisualization #mathematics

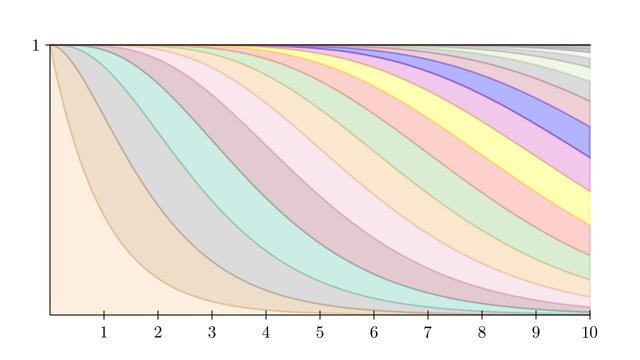
Decomposition of the exponential function as the sum:
x⁰/0! + x¹/1! + x²/2! + x³/3! + ...

* On the left, low-order terms are at the bottom.
* On the right, low-order terms are at the top.

Same color in both pictures corresponds to the same monomial.

Crazy how different the two pictures look, even though they represent the same decomposition!

#manim #MadeWithManim