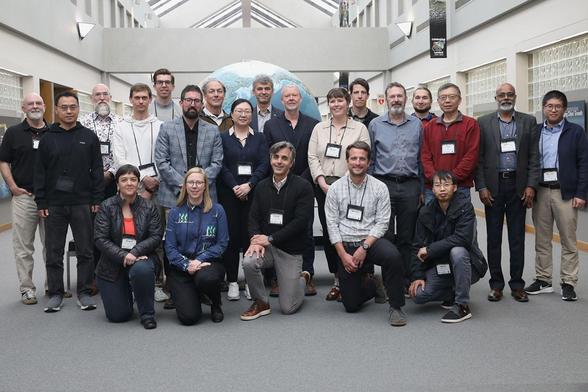
New Landsat Science Team Holds First In-Person Meeting

New Landsat Science Team Holds First In-Person Meeting
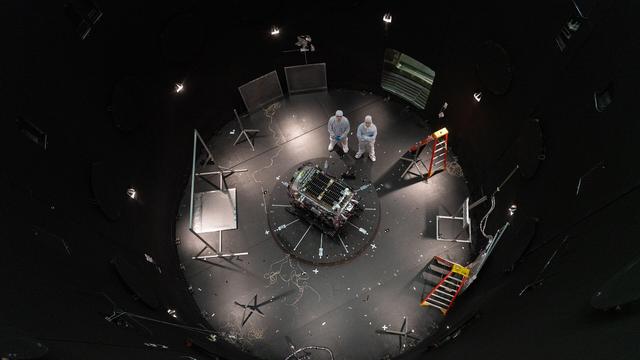
Testing for the Katalyst-NASA Swift Boost Mission 🌎
#Ast #Astrophysics #Earth #GammaRayBurst #Landsat #RoboticArm #Robotics #Space
⏩ 2 new pictures and 1 new video from NASA (SVS) https://commons.wikimedia.org/wiki/Special:ListFiles?limit=20&user=OptimusPrimeBot&ilshowall=1&offset=20260528130128
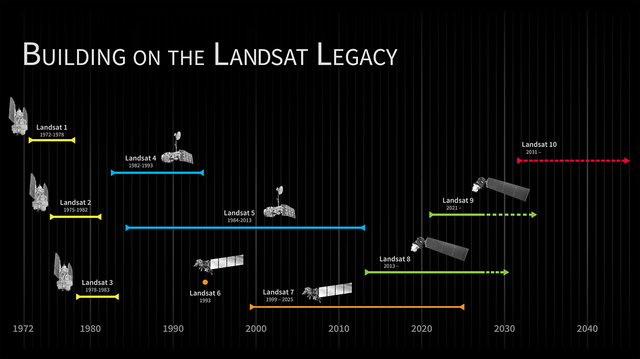
Released: NASA Goddard Issues Draft Request for Proposal for the Landsat 10 Spacecraft
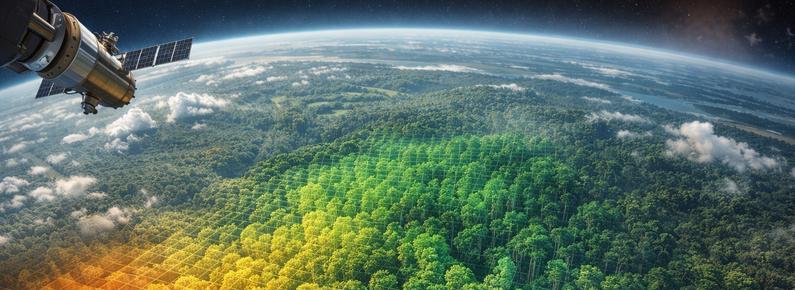
Wie lässt sich das Wachstum von #Wäldern messen, wenn sie für Menschen kaum zugänglich sind?
Mit jahrzehntealten #Satellitendaten und neuen KI-Methoden kann man überraschend viel aus alten Fotos berechnen. Wie sich #Sekundärwälder und #Plantagen dabei unterscheiden, erfahrt ihr im Artikel.
https://tino-eberl.de/nutzen-kuenstlicher-intelligenz/waldwachstum-satellitendaten-landsat/
#Erdbeobachtung #Fernerkundung #Waldmonitoring #Landsat #Klimaforschung #CO2Speicherung #Satellitendaten #Forstwirtschaft
NASA Landsat Interactive Uses Satellite Imagery to Spell Names with Earth’s Landscapes
📰 Original title: Spell Your Name With Rivers, Deltas, Lakes, and Deserts
🤖 IA: It's not clickbait ✅
👥 Users: It's not clickbait ✅
View full AI summary: https://en.killbait.com/nasa-landsat-interactive-uses-satellite-imagery-to-spell-names-with-earth-s-landscapes.html?utm_source=mastodon_world&utm_medium=social&utm_campaign=killbait.mastodon_world
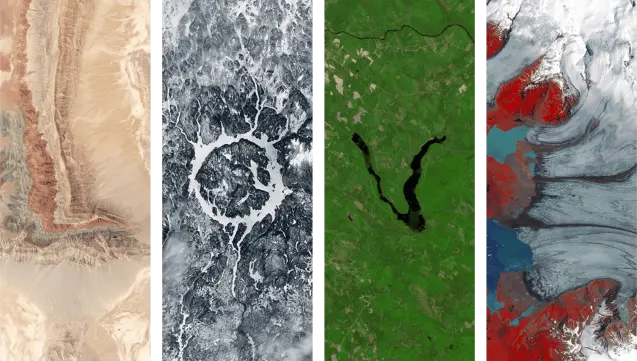
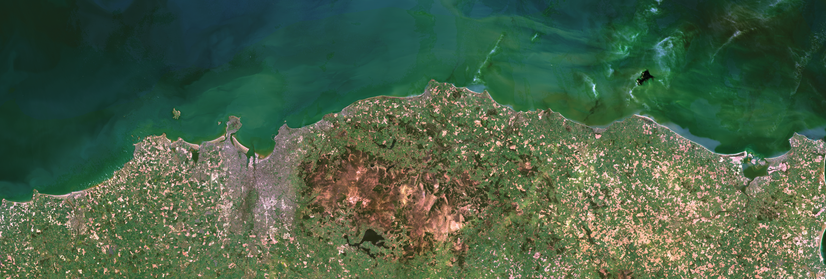
NASA, in collaboration with the U.S. Geological Survey, has introduced a creative Earth Day 2026 project called “Your Name in Landsat,” which transforms satellite imagery into a playful, personalized experience. The interactive tool allows users to type in any word or name and generates a vertical sequence of satellite image tiles from the Landsat archive that resemble letters of the alphabet. These letters are not artificially designed but are instead found within natural and human-made landscapes captured from space over decades. The Landsat program, which has been observing Earth continuously since 1972, provides one of the longest-running records of the planet’s surface. Its imagery is widely used by scientists to study environmental changes such as deforestation, urban expansion, agricultural patterns, wildfire impacts, water use, and coastal erosion. In this new interactive format, that vast scientific archive is reimagined as a visual alphabet, turning global geography into a form of typographic expression. Each generated letter corresponds to a real location on Earth, such as winding rivers, lake edges, desert formations, or agricultural grids. A river bend might resemble a “G,” while a shoreline or lake outline could form an “S.” Irrigated farmland often produces sharp geometric shapes, while natural terrain creates more fluid and irregular letterforms. Every tile also includes geographic metadata, including coordinates, allowing users to explore the real-world locations behind each letter. The result is both artistic and educational, blending science communication with visual creativity. It highlights how Earth’s surface, when viewed from orbit, naturally contains patterns that resemble written language. The project encourages users to reflect on the planet as both a scientific system and a source of unexpected beauty, where landscapes themselves become a kind of accidental typography.
NASA Landsat Interactive Uses Satellite Imagery to Spell Names with Earth’s Landscapes
📰 Original title: Spell Your Name With Rivers, Deltas, Lakes, and Deserts
🤖 IA: It's not clickbait ✅
👥 Users: It's not clickbait ✅
View full AI summary: https://en.killbait.com/nasa-landsat-interactive-uses-satellite-imagery-to-spell-names-with-earth-s-landscapes.html?utm_source=mastodon_social&utm_medium=social&utm_campaign=killbait.mastodon_social
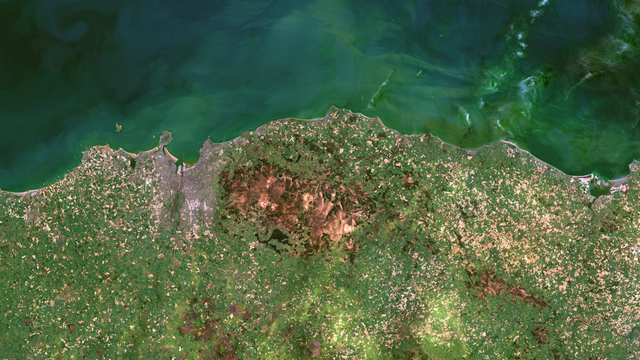
NASA, in collaboration with the U.S. Geological Survey, has introduced a creative Earth Day 2026 project called “Your Name in Landsat,” which transforms satellite imagery into a playful, personalized experience. The interactive tool allows users to type in any word or name and generates a vertical sequence of satellite image tiles from the Landsat archive that resemble letters of the alphabet. These letters are not artificially designed but are instead found within natural and human-made landscapes captured from space over decades. The Landsat program, which has been observing Earth continuously since 1972, provides one of the longest-running records of the planet’s surface. Its imagery is widely used by scientists to study environmental changes such as deforestation, urban expansion, agricultural patterns, wildfire impacts, water use, and coastal erosion. In this new interactive format, that vast scientific archive is reimagined as a visual alphabet, turning global geography into a form of typographic expression. Each generated letter corresponds to a real location on Earth, such as winding rivers, lake edges, desert formations, or agricultural grids. A river bend might resemble a “G,” while a shoreline or lake outline could form an “S.” Irrigated farmland often produces sharp geometric shapes, while natural terrain creates more fluid and irregular letterforms. Every tile also includes geographic metadata, including coordinates, allowing users to explore the real-world locations behind each letter. The result is both artistic and educational, blending science communication with visual creativity. It highlights how Earth’s surface, when viewed from orbit, naturally contains patterns that resemble written language. The project encourages users to reflect on the planet as both a scientific system and a source of unexpected beauty, where landscapes themselves become a kind of accidental typography.