Julia set of the day:
\[
c = -0.45647026600561186-0.5760778550297182i
\]
Julia set of the day:
\[
c = -0.45647026600561186-0.5760778550297182i
\]


Gax
Real: -0.74902794876978160505213294376539741
Imag: 0.052541061922498475895583517155422518
Size: 3e-18

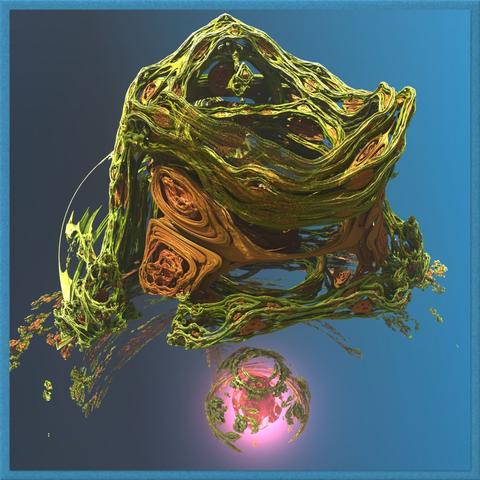
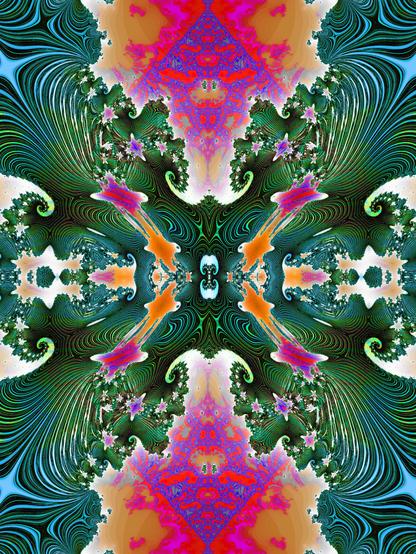
Got higher quality images to work using multisampling / pixel value averaging.

Qwen3 VL 30B A3B Q4 is so cool at the same time. I had to plot that in FORTRAN 90 once upon a time, it was not as fast..
NB: python code needed a tiny bit of tweaking but it worked✅
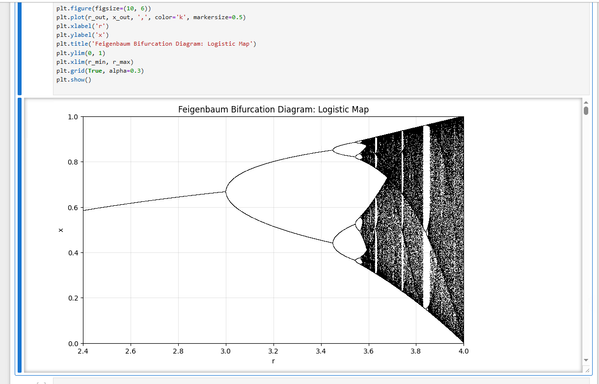
It's the Feigenbaum Bifurcation Diagram, from the logistic map. (llama.cpp could present the maths correctly as well).
NB: it is pointless to do that without understanding what it means (I'm still trying to figure out 20 yrs+ later, it is not like if chaos is a simple subject).
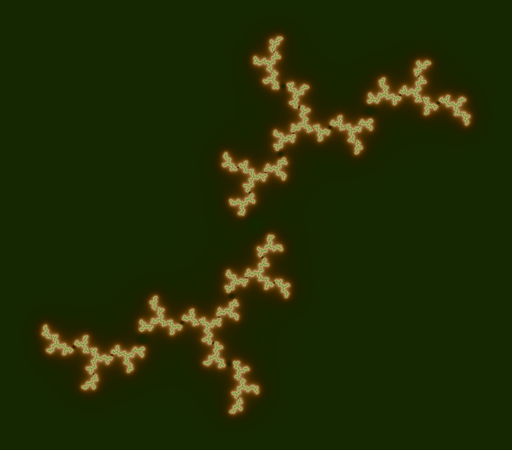
Julia set of the day:
\[
c = 0.003986228489196726+0.9885492698886179i
\]