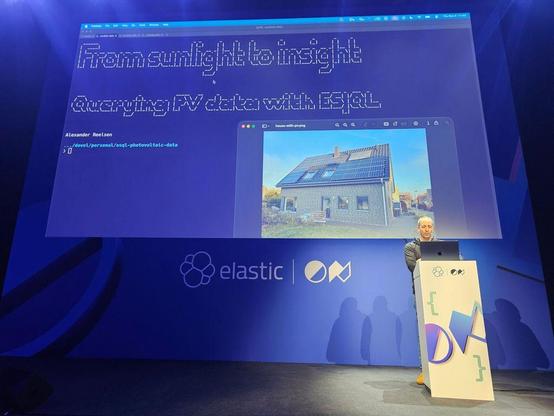
Achievement unlocked: Added a cover slide using a terminal with figlet to my no-slides #elasticon presentation showing ES|QL to look into three years of solar data.
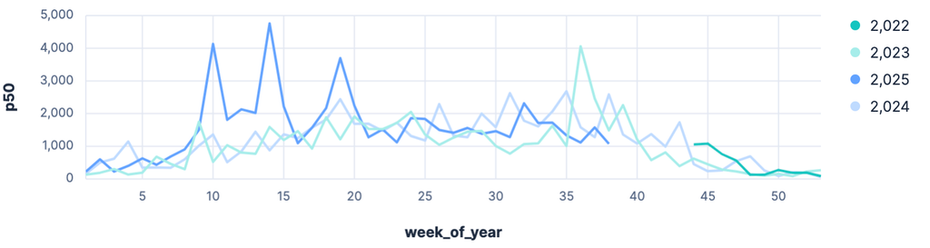
After the presentation quite a few folks came up to me and told me, why there was a certain PV produce during the time of year (less in July due to hot temperatures reducing production, thus higher in April). Thanks for all the pointers.
A part of the demo has also been written down in a blog post. See https://spinscale.de/posts/2025-10-07-solar-power-monitoring-with-elasticsearch-and-esql.html