videos from SciPy 2024 are live! here's my talk on a vision for composable interactive data visualization with #anywidget

trevor manz
@manzt
- 33 Followers
- 35 Following
- 20 Posts
phd-ing in boston
i keep finding fun/interesting workflows that fall out of quak's query-based design
example: define a table subset interactively, copy the SQL, and run it in
@duckdb cli to build unix pipelines
kudos to @Posit for adding support for Jupyter Widgets in Positron IDE!
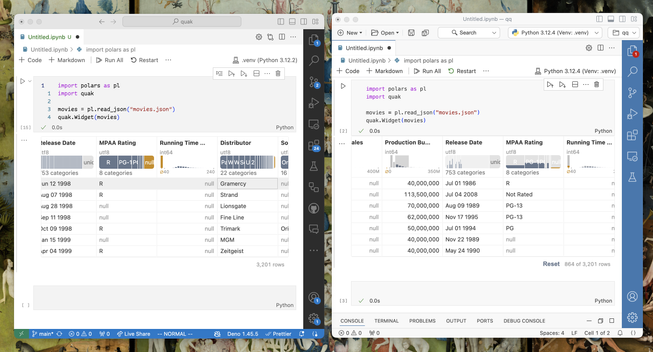
just fixed a scroll behavior issue, and now quak works swimmingly in VS Code (left) and Positron (right) thanks to #anywidget
quak 🦆 v0.1.3 adds a hover indicator for summary histograms, thanks to @dvdkouril

Thrilled @marimo_io is standardizing on #anywidget for their plugin API! Our projects are really well aligned, pushing widget interactivity beyond Jupyter.
Learn more in our blog post: https://marimo.io/blog/anywidget

couldn't help myself and made a very crude but working #rstats #htmlwidget out of @manzt new quak
https://github.com/timelyportfolio/quak/tree/htmlwidget/htmlwidget

@timelyportfolio @dom My vision for anywidget is to standardize frontend ESM for native execution across various backends (languages). Marimo notebooks already support this, bypassing Jupyter widgets. It also works with the deno Jupyter kernel. Excited about anyhtmlwidget as an R adapter. This promises unified frontend packaging, though backend APIs still need maintenance.
The core idea in quak is that all table state is expressed via database queries. User interactions produce SQL, executed lazily at the database level (DuckDB) to refresh data views.
This SQL can also be accessed in Jupyter to materialize data subsets for further analysis.
Excited to introduce quak 🦆 (https://github.com/manzt/quak) a scalable, interactive data profiler built with #anywidget.
- 🖱️ crossfilter & sort millions of rows in real time
- 🔄 supports any Apache Arrow __dataframe__
- ⚡ powered by Mosaic & DuckDB
- 📓 materialize data subsets back in Jupyter

i made a little website to select and export calendar invites (.ics) for events at the 2024 #Olympic games https://olympicks.xyz
