v1.1.0 of {ggsurvfit} 📦 is on CRAN!
This release primarily includes updates to account for changes in the {survival}📦, but does include a few other gems.
https://www.danieldsjoberg.com/ggsurvfit
#rstats #datascience #survivalanalysis #ggsurvfit #cran

Flexible Time-to-Event Figures
Ease the creation of time-to-event (i.e. survival) endpoint figures. The modular functions create figures ready for publication. Each of the functions that add to or modify the figure are written as proper ggplot2 geoms or stat methods, allowing the functions from this package to be combined with any function or customization from ggplot2 and other ggplot2 extension packages.
Check out my webinar on visualization of survival or time-to-event data using the {ggsurvfit} package.
@RConsortium
Jan 25, registration information below!
https://www.r-consortium.org/blog/2024/01/04/harness-the-power-of-r-for-survival-analysis-join-our-ggsurvfit-webinar

Harness the Power of R for Survival Analysis: Join Our {ggsurvfit} Webinar! - R Consortium
Hello, Data Enthusiasts! Are you ready to take your data visualization skills to the next level in the fascinating world of survival analysis? We’re thrilled to invite you to our...
Hello #rstats friends!
The {ggsurvfit} package made its v1.0 release! 🕺🏻🕺🏻
Check it out for your survival/time-to-event visualization needs! The plots are fully ggplot and integrate seamlessly with all the ggplot functions you you already know 📈
#datascience #survival #cran
https://www.danieldsjoberg.com/ggsurvfit/index.html
Flexible Time-to-Event Figures
Ease the creation of time-to-event (i.e. survival) endpoint
figures. The modular functions create figures ready for publication.
Each of the functions that add to or modify the figure are written as
proper ggplot2 geoms or stat methods, allowing the functions from
this package to be combined with any function or customization from
ggplot2 and other ggplot2 extension packages.
The Quarterly Journal of Economics table theme has been finalized. Now you can get default tables that adhere to the journal's reporting guidelines.
New theme elements to control default styling/structure of headers in summary tables. I like having my Ns on a new line, and this can make it happen by default!
https://www.danieldsjoberg.com/gtsummary/articles/themes.html#writing-themes

gtsummary themes
gtsummary
A new function `add_ci.tbl_svysummary()` has been added for including confidence intervals to point estimates for survey summary tables!
Please to announce the latest release of the {gtsummary}📦!
My favorite new feature is that header rows in flextable output now recognize markdown syntax for bold/italic😍🤓
http://bit.ly/r-gtsummary
#rstats #datascience #gtsummary

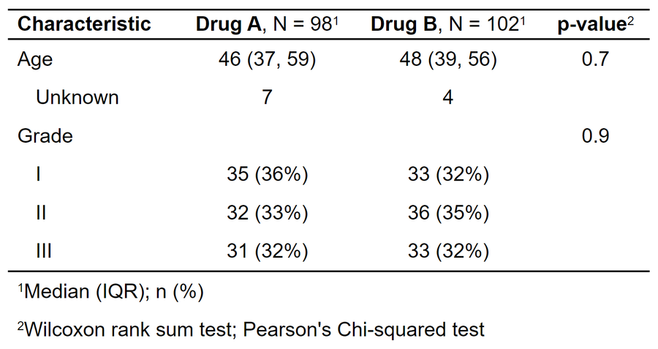
Presentation-Ready Data Summary and Analytic Result Tables
Creates presentation-ready tables summarizing data sets, regression models, and more. The code to create the tables is concise and highly customizable. Data frames can be summarized with any function, e.g. mean(), median(), even user-written functions. Regression models are summarized and include the reference rows for categorical variables. Common regression models, such as logistic regression and Cox proportional hazards regression, are automatically identified and the tables are pre-filled with appropriate column headers.
I am excited to let you know about the newest release of the {ggsurvfit}📦!
Mostly minor changes in this patch release. But please do check out the listing of all changes!
https://danieldsjoberg.com/ggsurvfit/
#rstats #datascience #ggsurvfit