WaitForPresent

207 Followers
330 Following
308 Posts
Making Code go brrrrrrrrr at Keen Games. Previously Shapefarm, Ubisoft.
I just want to wrap my bindless handles in some "type-safe" struct and it immediately starts to a) occupy a fresh 16 byte row and b) does fill it entirely. While I really don't care too much about the memory loss on the constantbuffer, editing it requires special handling compared to push constants/structured buffers which just bumps mental load while programming. And for no good reason, I am still only using a plain 32bit unsigned integer afterall.
Now when viewing the data I have the problem that I just run too many fibers (256 to be precise). This leads to the view being cluttered with lots of scattered data points and is REALLY hard to read. I can't really find a way to reduce this somehow. In my native profiler I pin each thread to a logical core and then project the fiber data onto the thread that it is running on. This probably only works in this setup but it leads to a pretty clean overview that you'd also have without the fibers.
One of the first major features that I worked on for EverythingIsFine was an instrumented profiler. Not only is it awkward to instrument your code in hindsight but it also a good way to visualize your code flow :)
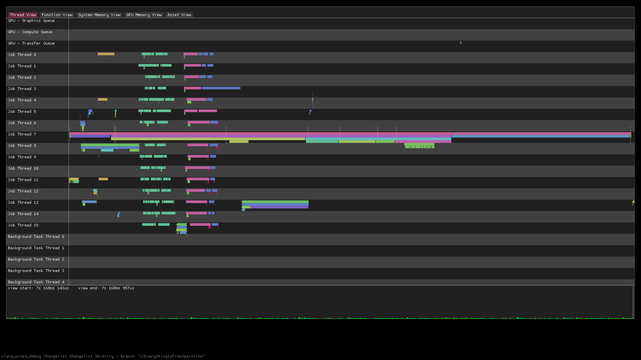
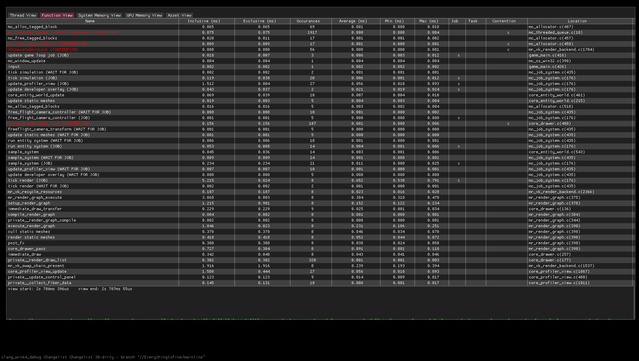
This is (roughly) how the data viewer looks like right now. It's still WIP but already tremendously helpful.
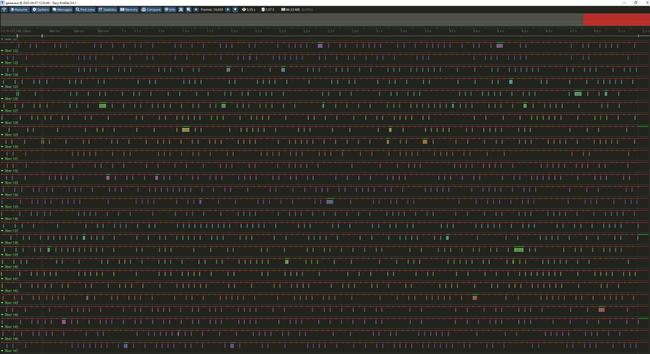
The view can scrub through the last 300 frames, which gives plenty of data to analyze at the hand of the button press. For everything else @superluminal is super handy ofc :D
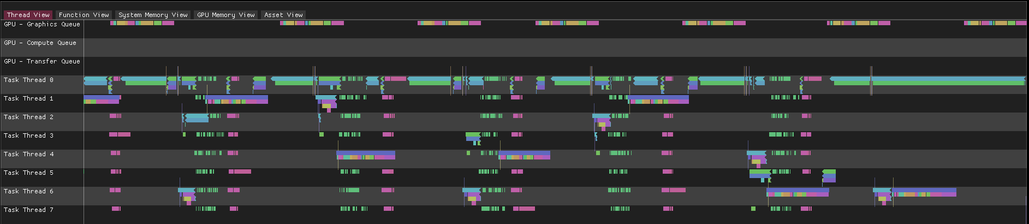