Cédric Scherer

2.3K Followers
476 Following
230 Posts
🧙‍♂️✨📊 Independent #DataViz Designer, Consultant & Instructor ♢ PhD in Computational Ecology ♢ #rstats #ggplot2 #figma#graphics #maps #ddj #design ♢ he/him
Websitehttps://www.cedricscherer.com
Behancehttps://www.behance.net/cedscherer
GitHubhttps://www.github.com/z3tt
Twitterhttps://www.twitter.com/CedScherer

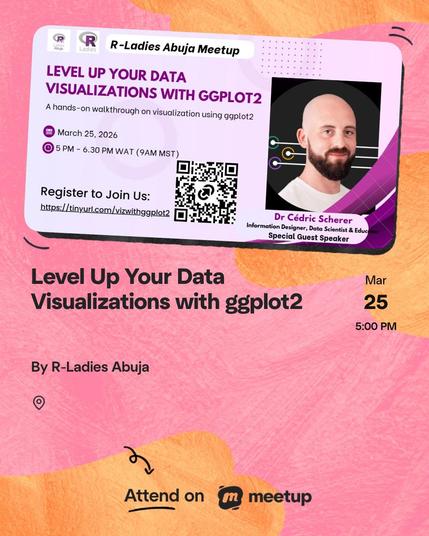
I’m giving a talk at R-Ladies Abuja next week 💜 💙

We’ll dive into #ggplot2 tricks from our "ggplot2 uncharted" class — focusing on both #dataviz best practices and advanced #coding 💪

Sign up for the free session here:
https://www.meetup.com/rladies-abuja/events/313505524/

#datavis #rstats #tidyverse #datascience

Hieran habe ich seit langem gearbeitet: Ein Dashboard zu den Verspätungen & Ausfällen bei der #Bahn. Das entsprechende #OpenData veröffentlicht das Unternehmen in Echtzeit. Auf Mastodon gibt es täglich Infos unter @verspaetung – das Dashboard findet sich unter https://verspaetung.net

I just opted out of a workshop opportunity with a heavy heart. But I learned it's a collaboration with DataCamp.

A friendly reminder that you likely don't want to support this type of company due to their history: https://dnlmc.medium.com/dont-use-datacamp-ef04adcf1b7f

There are soooo many other options that value you, the communities, and the course instructors!

Don’t use DataCamp

A timeline of transgressions & community response

Medium
@cartocalypse 😅 🥴

"Vibe Coding" the old-school way 🌈

I was prepping a ggplot2 lesson when a stat_summary() error went sideways. Instead of fixing it, I leaned in.

Sometimes the best dataviz is found in the detours.
(Or at least, the most joy on a Monday ☕️)

#rstats #ggplot2 #dataviz #TheSimpsons

The version in our online "ggplot2 [un]charted" workshop to illustrate how to create partial radial plots with #ggplot2 — part of the lesson "Coordinate Systems: Setting the Stage for Your Plot"

https://www.ggplot2-uncharted.com/module1/coordinates

Last week, I crafted my first-ever gauge chart 🏎️ to showcase partial radial plots for our #ggplot2 [un]charted lesson on "coordinate systems".

Thanks to coord_radial(), partial circles like those are super easy now — and of course I couldn’t resist making a polished and animated version 💅📽️

#dataviz #rstats #tidyverse #ggplot2

Working on the latest lesson for our interactive online workshop "ggplot2 [un]charted", I let loose a bit...

The sections ended up fun — yes, and maybe a bit silly at times 🤡

My personal highlight:
our very own #aesthetics anthem as a memorable mnemonic to recall the most important — and likely most frustrating — concept of #ggplot2 ✨🎶✨

New lesson out now 👉 https://www.ggplot2-uncharted.com/module1/aesthetics-caveats

@Herover Moderating all platforms is too much and none of the organizers is active here. Looking at the posts so far it seems not worth it as, as usual, interaction levels are super low here 😔
@alessandro_a Btw, the "switched" order of wins and losses is also reflected in the title phrasing and coloring to provide guidance. At least that was the idea.