 astropic
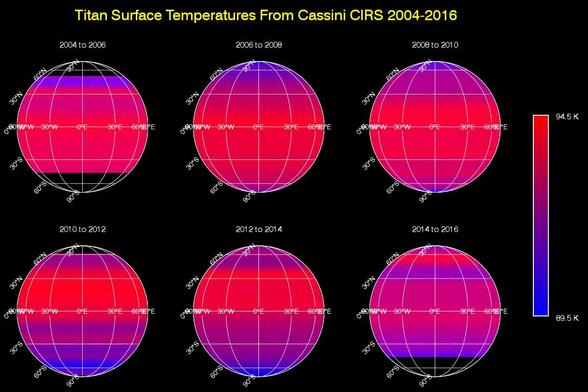
Titan Temperature Lag Maps
This sequence of maps shows varying surface temperatures on Saturn moon Titan at two-year intervals, from 2004 to 2016. The measurements were made by the Composite Infrared Spectrometer CIRS instrument on NASA Cassini spacecraft. The maps show thermal infrared radiation (heat) coming from Titan's surface at a wavel...
More: https://images.nasa.gov/details/PIA20020
Credit: NASA/JPL-Caltech/GSFC
#titan #cassini #cassinihuygens #astrodon #astronomy #astrophotography #astrophysics