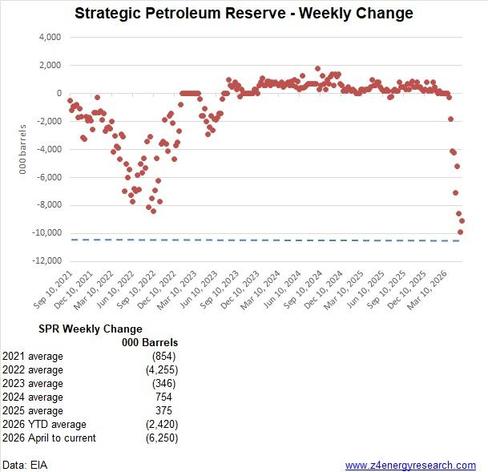
today in "how bad is it?": US #SPR
Provided by @altbot, generated privately and locally using Gemma4:26b
@kali A line graph titled "Strategic Petroleum Reserve - Weekly Change" tracks changes in "000 barrels" from Sep 10, 2021, to Mar 10, 2026. The vertical axis ranges from -12,000 to 4,000, with the red data points showing a decline through 2022, values near the zero line from 2023 to 2025, and a steep drop at the end of the timeline. Below the graph, a list titled "SPR Weekly Change" provides "000 Barrels" data: 2021 average (854), 2022 average (4,255), 2023 average (346), 2024 average 754, 2025 average 375, 20 2026 YTD average (2,420), and 2026 April to current (6,250). The bottom of the image features the text "Data: EIA" and "www.z4energyresearch.com".
🌱 Energy used: 0.512 Wh