Provided by @altbot, generated privately and locally using Gemma4:26b
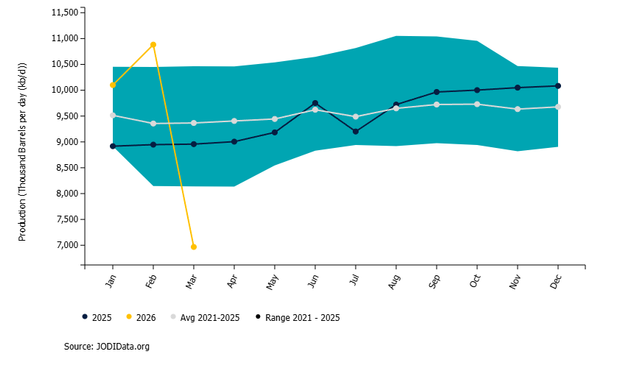
@kali A line graph displays monthly production in thousand barrels per day (kb/dj (kb/dj) from January to December. The vertical axis is labeled "Production (Thousand Barrels per day (kb/dj))" and ranges from 7,000 to 11,500, while the horizontal axis lists the months from "Jan" to "Dec". The graph features a dark blue line for "2025", a yellow line for "2026", a light grey line for "Avg 2021-2025", and a teal shaded area for "Range 2021 - 202 2025". The 2025 line fluctuates between approximately 8,900 and 10,000, the 2026 line rises to nearly 11,000 in February before dropping to 7,000 in March, and the grey line remains stable near 9,500. The text "Source: JODIData.org" is located at the bottom.
🌱 Energy used: 0.637 Wh