Hi, these are the weekly #washingtonstate #kingcounty (that is, #seattle and environs) #COVID #COVID19 #wastewater toots.
A quick reminder that this King County respiratory disease data comes from Washington State, not the federal government.
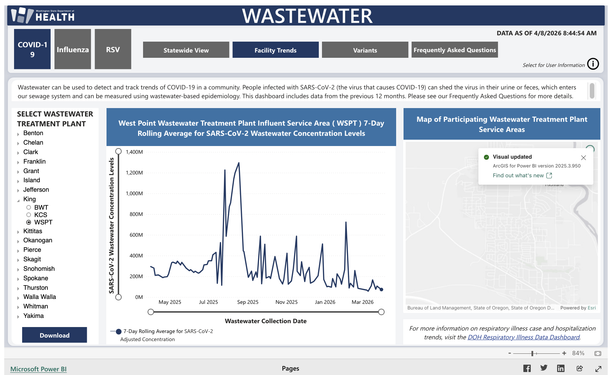
The West Point (WSPT) sewage treatment plant's 7 day running average of its detected Sars-CoV-2 levels is pretty low. The last calculation was made on 3/31.
WSPT is one of three King County(-ish) sewersheds in this dataset. You can find overviews, individual sewershed results, and a breakdown of variants for the state wastewater surveillance program, along with other metrics like case counts and hospitalizations for Covid-19 and other respiratory illnesses, at doh.wa.gov/data-and-statistica. If you go to the page and click "learn more" in the statewide view tab, you can find out lots of details about how these data are calculated and how to interpret them. The dashboard gets updated every Wednesday (generally). The Department of Health is here on the fediweb, at
@WADeptHealth