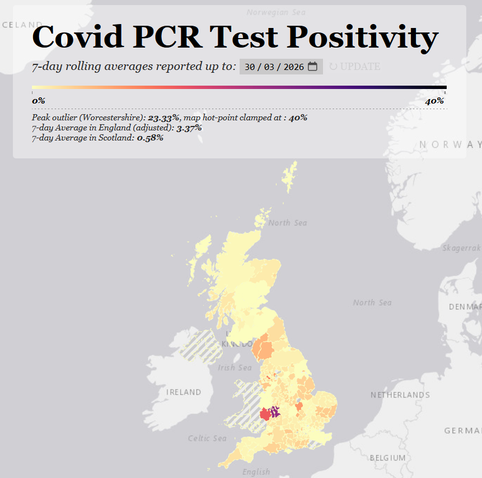
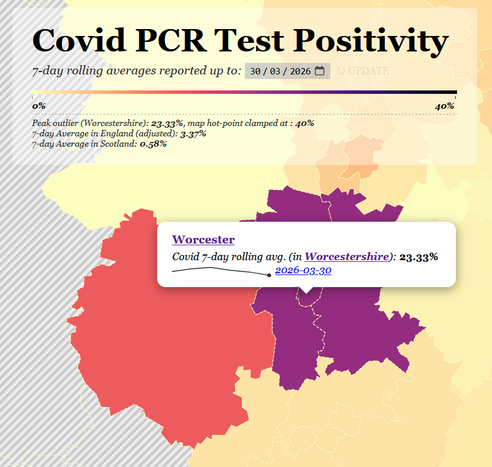
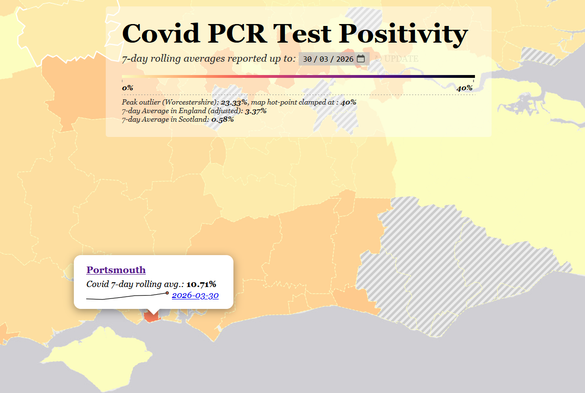
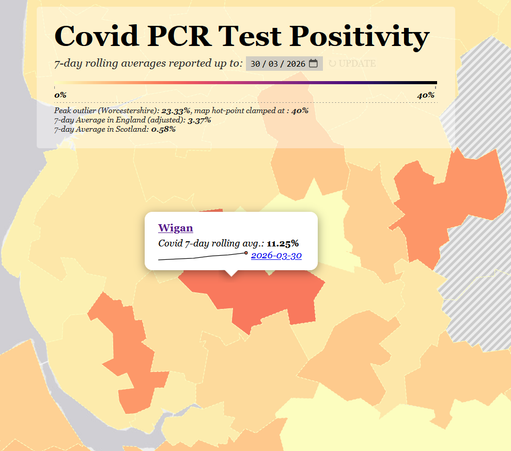
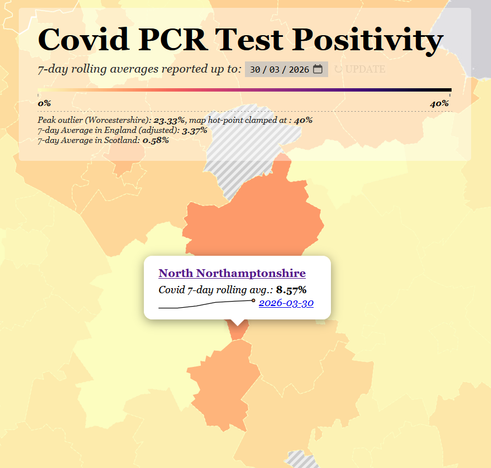
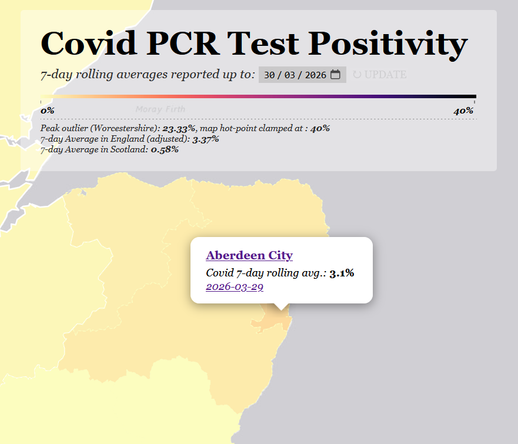
The PCR positivity map is out and levels are still pretty stable or declining.

This is the last week of winter NHS stats. There are 372 patients still in covid beds. The hospital trend is up in London and the SE, down elsewhere.

https://jamestindall.info/skeuomorphology/ladb_covid/index.html

1/8

#covid #coviD19 #longCovid #uk

For most of us it's good news for Easter week.

Even in the outlier Worcestershire, levels and beds are heading down at last.

Unfortunately there's a new rise in neighbouring Herefordshire.

2/8

A lot of non-reporting in the SE, but we can spot Portsmouth's on the rise.

This is very evident in Hampshire Hospital's stats: they'd finally reached single figures, but have bounced up again.

3/8

It looks like there's a bit of a surge centred on Wigan.

Most surrounding areas are showing a rising trend.

4/8

And there's a similar though more confined rise in North Northants. and Milton Keynes.

5/8

Levels look to have flattened all across Scotland now: only 26 positives all told. Incredible.

The highest is in Aberdeen City, on 3.1%.

6/8

As I hope you can tell, I'm pretty happy with this continuing lull.

We have a soup of ~14 different variants, none of them threatening dominance. Long may that last.

7/8

That said, levels are extremely variable from area to area. I'd love to know which variants are in the hotspots.

It's during these periods that the map shows its worth most, I feel: we would otherwise be completely unaware of how variable the risk is.

8/8