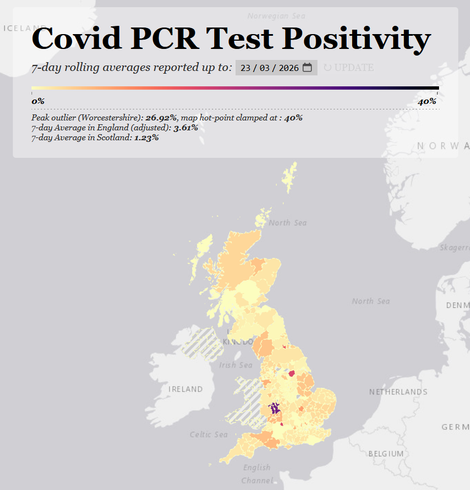
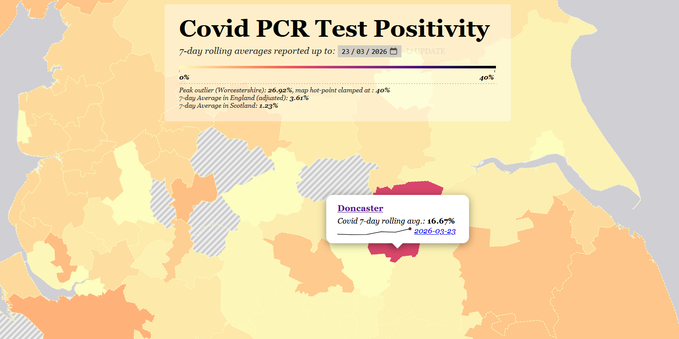
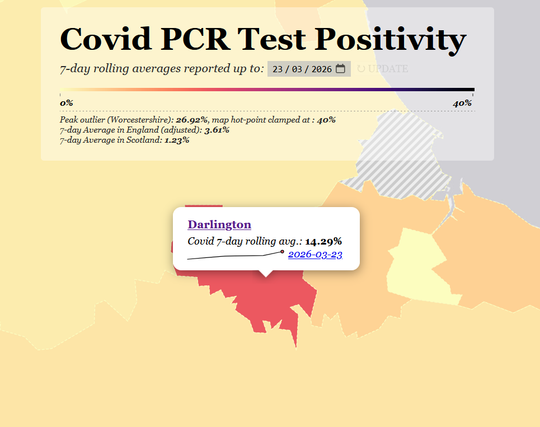
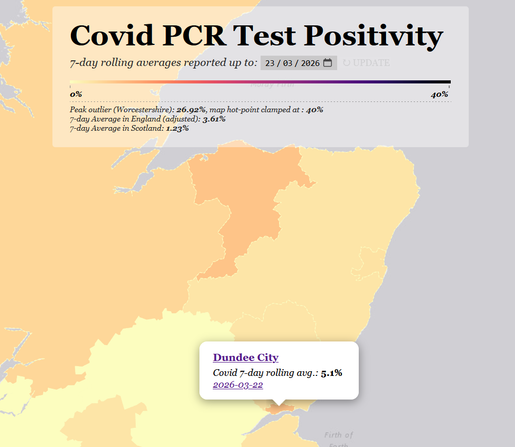
The PCR positivity map is out and levels have inched slightly upwards in England, slightly downwards in Scotland.

We're coming to the end of the winter reporting season, and the NHS stats are being reported very irregularly.

https://jamestindall.info/skeuomorphology/ladb_covid/index.html

1/7

#covID19 #covid #longCovid #uk

London continues to see higher levels than most other places.

Covid beds are increasing at Imperial, steady at the Royal Free, and some are sadly back at Great Ormond - which may add some justification to concerns about current variants.

2/7

Beds are also up noticeably in the South-West.

Plymouth's reporting positivity is well above the average, as is Dorset and Somerset.

3/7

Worcestershire continues to be the outlier, and this is absolutely evidenced by the increase in inpatient cases.

If you live in an adjacent county, do check the trendline for your area - most are heading up.

4/7

If you live anywhere between Liverpool and Lincolnshire, I'd also advise checking your area, and trying to check adjacent areas too.

There's so much non-reporting, but Knowlsley, Rochdale, Manchester, Sheffield are all rising.

5/7

Darlington's reporting rather high levels, but I can't see that reflected in hospital beds.

I'd like to see stats for Middlesbrough and Hartlepool before being sure, though note Stockton and Redcar are rising.

6/7

Levels in the south of Scotland have really calmed down.

The higher levels are confined to Dundee and Moray, with a slight rise in Highland.

7/7