Why is it so hard to find a simple explanation of mathematical "poles" as it pertains to 2-pole and 4-pole low pass filters on synthesizers? All the explanations are either too abstract or too simplified.
@990000 The math behind that is not so easy, true. But perhaps someone might give you a hint or two if you were to mention what kind of an understanding you're looking for and roughly where you are stuck on the way there.
@semit0ne the web is littered with the same question over and over about what a pole is and the answers are always some complicated description of functions that result in singularity, but I can’t really wrap my head around how that would pertain to a 2/4 pole filter. I’ve seen the graphs of 2/4 pole filters but I can’t quite understand what makes them poled. I just see a steep slope in 2 and a less steep slope in 4 but that doesn’t explain what a pole is, at least not in terms of the graph.
@990000 The term pole refers to the Laplace transform of the transfer function, the mathematical description of how a circuit reacts to an input signal. These are polynomial fractions and a pole is a zero (or root) of the polynomial in the denominator. If you graph the magnitude of this transform of the transfer function you get the graph you are used to (the frequency response). I guess, that's not very useful to you because it assumes knowledge of circuits, the Laplace transform etc.
@semit0ne thanks, ok but it's not clear how poled functions are represented for example. Specifically a 2/4 pole filter frequency response visualization. This is the only thing I'm familiar with and can understand as far as electronic sound is concerned, but I'm unable to get what makes it 2 or 4 pole in terms of the geometry of the line. I'm looking at a graph like this. I see how the 4 is steeper than the 2, but I don't understand anything beyond that. How does "pole" relate to these lines?
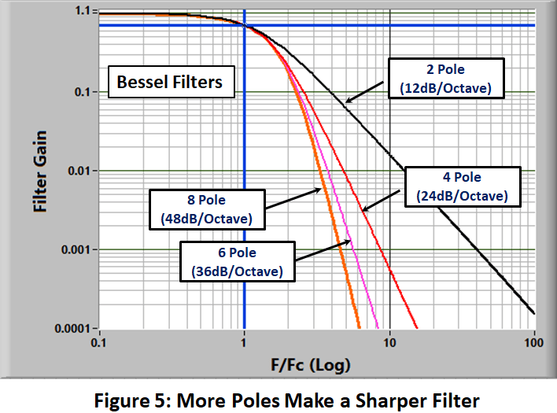
@990000 Poles are the zeros of the denominator of the Laplace transform of the transfer function. This graph is magnitude plotted against frequency, i.e. the amplification of the input signal for a given frequency. There are diagrams that explicitly show the poles and these are useful for exploring other properties when designing filters (in particular the resonance behavior in synth terms).
@990000 In the graph you can indirectly see the number of poles from the steepness of the rolloff. Additionally, you can see where the poles are located in the imaginary plane from the overall shape. The farther left the poles are in that plane, the more stable the filter (which amounts to less or no resonance from the synthesizer point of view). This diagram is usually called Pole Zero plot and that's a diagram where you can see the poles directly for what it's worth.
@semit0ne thanks! Do you know why the graphs generally look similar no matter how many poles? As in they all have a simple L-shape. Is it because the plot only shows a partial view of the function? I guess I'm still trying to correlate what I think of as a "pole" with the line plot which might be the wrong way to think of it.
@semit0ne wait, I think this gets me a little closer