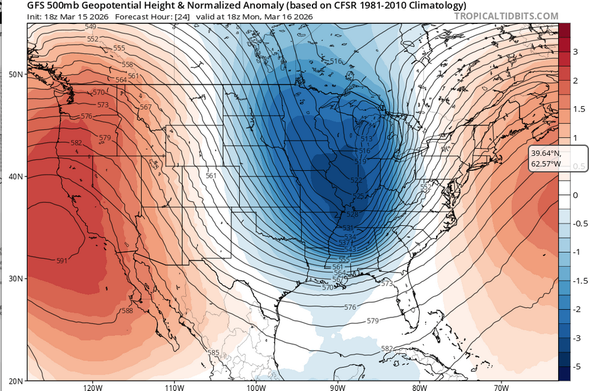
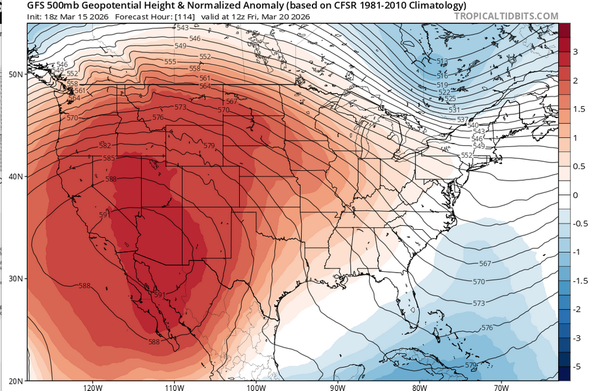
500mb Geopotential Height & Normalized Anomaly really is a great geeky weather visualization of "where is the extreme weather"
(Red = much warmer than normal, blue = much colder than normal = heat dome in California, and very cold weather centered over Ilinois in this Monday forecast, I believe).