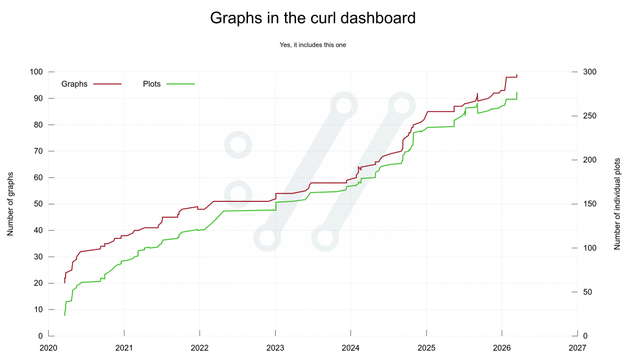
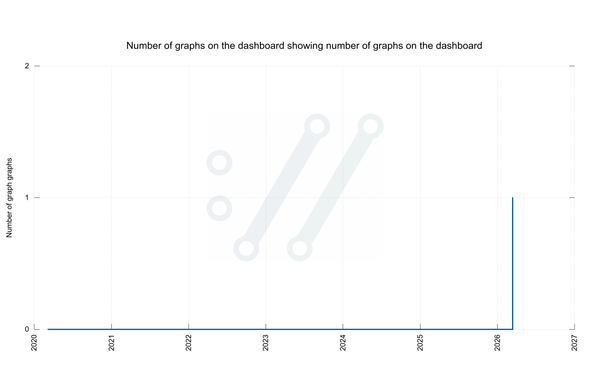
Some of you will be glad to know that the #curl dashboard now features the "graphs in the dashboard" graph

https://curl.se/dashboard1.html#graphs-on-the-dashboard

Number of graphs on the dashboard showing number of graphs on the dashboard. The graph.
@bagder Now do a graph of the number of posts about the number of graphs on the dashboard showing number of graphs on the dashboard. 😁
@veronica now my head hurts! 😁
@bagder @veronica Wikipedia has a list of lists of lists. Just a hint.
@bagder
Daniel this starts to get concerning
@bagder Valve logo in pieces waddaaheell
@bagder do a recursive task to add a new graph every year 😁
@bagder Is there a spécial kind of overflow that happens when working with graphs ? Do they support infinite recursion ?
@bagder well, this graph also shows a number of graphs, sooo… make it 2
@yukijoou but this second one is not in the dashboard so it does not include itself in the count
@yukijoou @bagder a graph showing a number of graphs on the dashboard showing a number of graphs on the dashboard not including themselves into the count.
@bagder Did you make that before publishing it?
@icing you need to read the subtitle in the graph! 😀
@bagder could you add a line to each graph that indicates when it was created? Some graphs have clear turning points. I wonder if that is when the graph was created.... (I.e does the measure become the objective)
@wdeborger ah, fun idea! I'll see what I can do
@bagder Very useful. Does it include itself?

Edit: you read my mind!
@bagder
what software do you use to make these?

@mansalia the curl dashboard [1] is all graphs done with gnuplot, and getting the data for the graphs is a large set of custom scripts [2].

[1] = https://curl.se/dashboard.html
[2] = https://github.com/curl/stats

curl - Project status dashboard

@bagder What is a plot vs. a graph in this context?
I found this question and some answers: https://math.stackexchange.com/questions/31073/when-should-i-use-graph-vs-plot