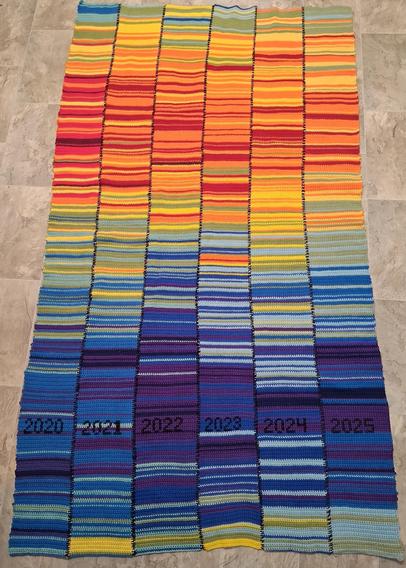
I have finished the temperature blanket panel for 2025! This is a decade-long project. Each stripe represents the local daily high temperature in farenheit: red is 90s, orange is 80s, yellow is 70s, and so on.
To capture the entire winter and summer seasons, the first bottom row actually starts on November 1st of the previous year, and the numbers are placed on January 1st of the labeled year, and it continues up from there.