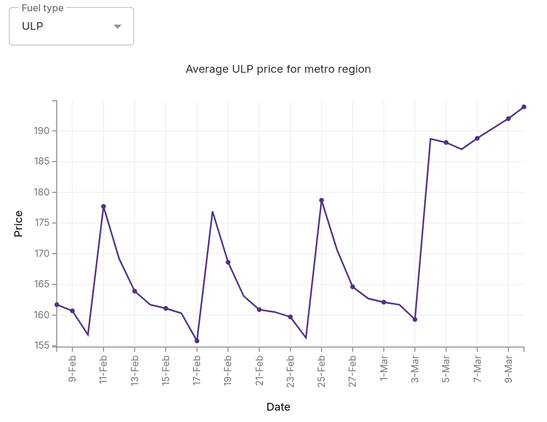
Petrol stations in Perth follow an easy to understand price fixing cycle.
Each Wednesday, all the petrol stations independently decide that fuel should be expensive. The price then decays over the week until it hits its lowest point on Tuesday, after which the cycle repeats.
This has worked as reliably as clockwork, right up until the recent Iran war. It will be interesting to see whether the old cycle picks up again once things settle down.
The graph comes from the WA Government Fuel Watch website: https://www.fuelwatch.wa.gov.au/retail/price-trends