So... what distribution is this histogram?

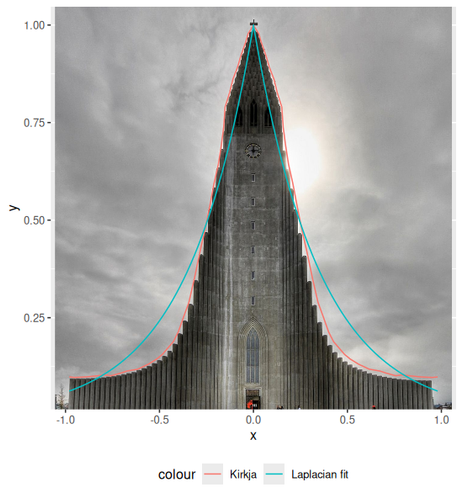
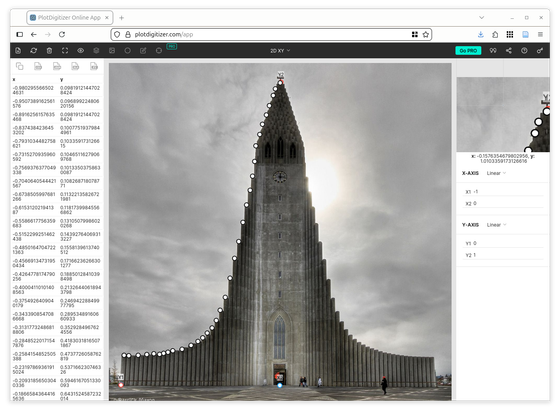
More than one reply suggesting Laplace distribution. I digitised the church's outline and then tried to fit a Laplace distribution. Here's the fit.

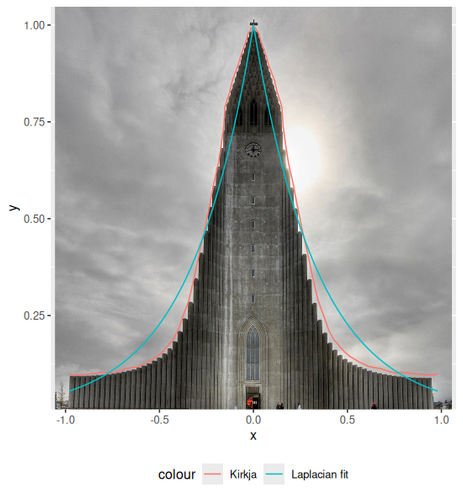
The main motivation to suggest Laplace, for me, was the pointy bit at the top. The tails are definitely too thick.
If we ignore the pointy peak, have you tried a t distribution, varying the number of degrees of freedom?
Tails are really fat, judging by the heights at the edges. That would incline me to guess a Cauchy distribution.
However, the central part appears to come to a point? That would incline me to a Laplace distribution.
No idea how to reconcile those, other than "Architects don't care about building resemblance to distributions." :-)