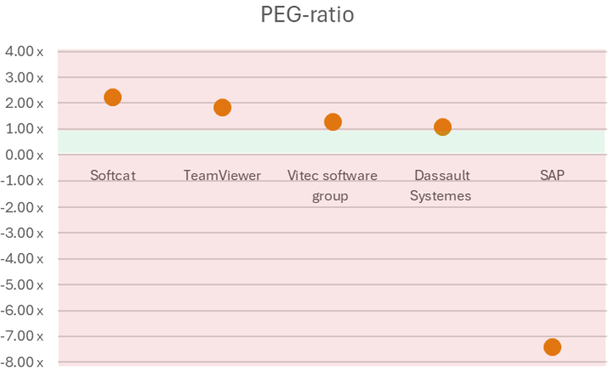
PEG-ratio, Tech Reality Check 🧐

#Tech stocks often trade on expectations, not fundamentals.

#PEGratio helps us test whether that optimism is supported by actual earnings growth.

Here’s how the sector performs!

🧵 (1/5)

#TheBarnBlog #FindItFinancials #valueinvesting #finance #markets

Company Breakdown 🧩

The results are clear:
🔴 No company in the sample grows fast enough to offset its P/E.
🟡 #SAP - elevated P/E, negative earnings growth.
🟡 #SageGroup, #TeamViewer - modest growth, but valuations remain demanding.

PEG isn’t harsh here and growth hasn’t kept up!

(2/5)

Margin of Safety, Missing in Action❌

With high PEG-ratios across the board, the margin of safety stays in negative territory.

This doesn’t mean the sector is broken, only that price and growth are out of sync on a historical basis.

#PEG is one signal and it points to *caution*!

(3/5)

Peer Comparison 🔄

Tech lands in the same bucket as #pharma on PEG:
📈⚠️ Positive growth, but not enough to justify current valuations.

#Construction and #fashion, by contrast, show more balanced price–growth dynamics.

(4/5)

Final Metric Awaits ⏳

Next up → #ROIC, the last metric in our screener!

It will show if tech’s capital efficiency tells a different story than PEG.

Full breakdown + graphs → https://thebarnblog.substack.com/p/finding-undervalued-companies-using

(5/5)

#TheBarnBlog #FindItFinancials #NotInvestmentAdvice

Finding undervalued companies using PEG-ratio

Part 4 of the screener series covers our third metric, PEG-ratio

The Barn