Time for a new topic. We will look at Viking 2 later.
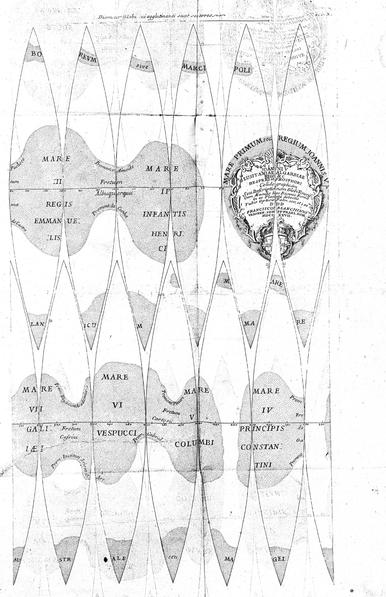
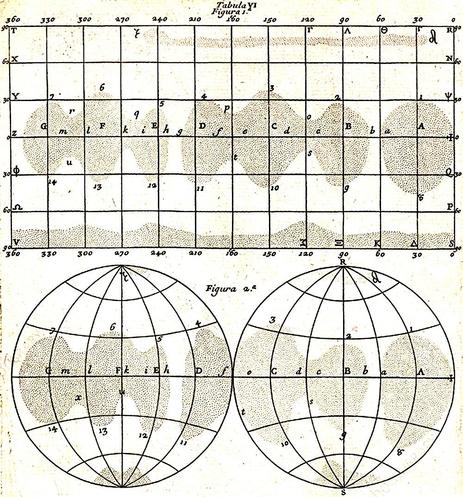
Pop quiz - which was the first solar system object after Earth and the Moon to be mapped? You at the back? - sorry, it's not Mars. No, the first after Earth and the Moon was Venus, by Francesco Bianchini, working in Rome. He made a globe of Venus in 1727 and published maps in a book in 1728. Of course the features are illusions, probably contrast effects in the eye.
#maps #venus #bianchini
Here are versions of that map in more easy-to-understand forms, cylindrical and azimuthal. Features are optical illusions, but I don't care - it's still a map. But why am I showing it here? Because, after my original atlas of lunar exploration I started work on an atlas of Venus and Mars exploration. It became apparent that Mars needed its own volume (and now there are three), so Venus went into its own book which is now abandoned.
#maps #venus #bianchini
Why abandon Venus? There's only so much one can do in a lifetime and I am pretty much devoting the rest of my life to the Moon.
#maps #venus

Bianchini was not the only person to map Venus before the space age. This paper by Percival Lowell:

https://adsabs.harvard.edu/pdf/1897MNRAS..57S.148L

presents observations, a map and a list of feature names for things that are obviously illusions. We see only clouds, contrasty in the ultraviolet but almost featureless in visible wavelengths. It might be - just barely - possible to argue that these lines originate in actual cloud features. There is another explanation too...
#maps #venus #lowell

In this article (presented page by page, but click 'print this article' to get a PDF of the whole thing):

https://articles.adsabs.harvard.edu//full/2003JHA....34...53S/0000057.000.html

Sheehan and Dobbins suggest the spoke pattern is a reflection of blood vessels in Lowell's eye. I am not totally convinced, feeling there ought to be more cases of it if true. But it is interesting.

Anyway, let's move on to more recent and reliable astronomy.
#maps #venus

2003JHA....34...53S Page 57

How about this for a weird map? But it is important. It comes from:

Boyer, C. and Camichel, H., 1961. Observations photographiques de la planète Vénus. Annales d'Astrophysique, Vol. 24, p. 531, 24, p.531.

https://articles.adsabs.harvard.edu//full/1961AnAp...24..531B/0000534.000.html

The authors took UV images of Venus in September 1953 and saw faint markings which they plotted in this map. Each day looked different, but the pattern repeats after 4 days. A 4 day segment is a global map of the clouds of Venus.
#maps #venus

At this time the rotation period of Venus was unknown. Lowell and many others thought the rotation was synchronous, like our Moon, with Venus always keeping the same face to the Sun. Various different rotation periods were suggested. Keep in mind that the surface was never seen and ideas varied from global desert to global ocean. Earth-based radar observed the surface from 1963 on, and revealed the 243 Earth day retrograde rotation. Soon after that we had the first radar maps.
#maps #venus

Let's take a peek at early Venus missions. In February 1961 two Soviet missions were launched - Sputnik 7 failed (the Sputnik designation concealed its planetary purpose) and Venera 1 made it to Venus, passing it at a distance of 100,000 km (the first ever planetary flyby). Sadly it had failed 10 days into the flight and provided no Venus data. It would have entered the atmosphere if luck prevailed but it didn't.

From July to September 1962 five missions launched to Venus...
#venus

... Three Soviet missions (Sputniks 19, 20 and 21) all failed and never left Earth, hence no 'Venera' designation. NASA launched Mariner 1 but it never got to orbit. Mariner 2 had better luck and became the first mission to return data from another planet - a very hot surface, a thick atmosphere of carbon dioxide, no magnetic field. Now we are getting somewhere! It was time plan some serious exploration.
#venus

In 2025 it's hard to understand how little Venus was known in the early 1960s. Those earliest Soviet probes were designed to float if they landed in an ocean. In 1963 this report:

Avco Corporation, 1963. Voyager design studies. Volume 1: Summary. Technical Report RAD-TR-63-34, 15 October 1963. Avco Research and Advanced Development Division, Wilmington, Massachusetts.

proposed a series of missions to both Venus and Mars...
#venus

... The project was called Voyager. When it was compiled the rotation period was unknown. This map shows a set of 3 Venus missions in successive launch opportunities. In 1970 probes would enter the atmosphere in mid-latitude sites straddling the terminator. In 1972 probes would study the sub- and anti-solar points. In 1973 and 1975 landers would go to those locations. Orbiters would map the planet as well. The map is blank because - they all were in 1963.
#maps #venus
I think the expressions 'hot pole' and 'cold pole' in the previous post imply that they still thought the rotation was synchronous. The true rotation state was only determined about the time this report was published. I should have added, Avco was under contract to NASA’s Office of Space Sciences for this study.

The first radar reflection from Venus was seen in 1961, and in 1962 the rotation was becoming clearer - retrograde and about 250 days. Irregularities in the radar spectra hinted at surface features. By 1964 they could be located roughly:

Goldstein, R. M., 1965. Preliminary Venus radar results. Journ. Res. Nat. Bur. Stds, Section D: Radio Science, v. 69D, pp. 1623-1625. https://nvlpubs.nist.gov/nistpubs/jres/69D/jresv69Dn12p1623_A1b.pdf

Finally a map with surface features...
#maps #venus

The surface of Venus gradually came into view more clearly. Here are two maps from 1965 (the linked paper) and 1969 (this paper:

Rogers, A.E.E. and Ingalls, R.P., 1969. Venus: Mapping the surface reflectivity by radar interferometry. Science, 165(3895), pp.797-799. )

Both are converted to my usual azimuthal projection. There were many steps between these and after, and a detailed history has never been put together. I used to dream of it.
#maps #venus

Goldstein only saw two features, Alpha and Beta (names we still use today). The other map by Rogers and Ingalls in 1969 shows many more features, unlabelled. The features in both maps are bright radar-reflective regions, meaning they are rough. Smooth areas appear dark, as do the unmapped areas around the periphery.

I think it's time for me to unveil my Venus map ... tomorrow...
#maps #venus

I needed a Venus map for my Atlas of Venus Exploration. Magellan was the only source of useful data. I combined two datasets: elevation from the radar altimeter and imaging from the SAR mapper. SAR shows craters and hills up close, but at global scale it mainly shows bright and dark (rough and smooth) areas. The elevation map is far inferior to our Moon and Mars datasets, and took a lot of cleaning up. Here is one side of the planet.
#maps #venus
There are more steps in the unveiling of Venus to come, so in a way this is out of sequence, but I needed to show it because it forms the background of other maps very soon.
The SAR image is shown very subdued here, draped over the shaded relief rendition of topography but just adding a few highlights like Beta Regio and Maxwell Montes. Tomorrow - the opposite hemisphere.
#maps #venus
Here is the other hemisphere of Venus. Most of the planet consists of plains, some smooth and some with ridges or various small volcanic features. Tessera areas are fractured hilly areas, apparently older than most plains. A few areas called Terra (Ishtar, Aphrodite and Leda) are high uplands - a bit like continents on Earth rising above the ocean floor. Lots of volcanoes but no obvious sign of plate tectonics. This was not my first Venus map...
#maps #venus

Some time in the 1980s, probably about 1984, before Magellan but with Pioneer Venus data and Earth-based radar, I made a hand-drawn pen and ink map of Venus on basically the same map projection. It was published in Sky and Telescope but I can't find the details - I have to dig through some dusty boxes. I will try to post it later in this thread. If you can find it, let me know!

Tomorrow, back to Venus missions.
#maps #venus

1964 was disastrous for Soviet Venus missions with four launches, only one of which left Earth orbit. That was Zond 1, but it failed on its way to Venus. 1965 was better. Venera 2 failed just before reaching Venus and flew silently past the planet. Venera 3, launched on 16 November 1965, entered the planet's atmosphere on 1 March 1966, the first ever physical contact with another planet. It failed just before it arrived, so no data. Where did it fall?
#venus
You are trying to hit a planet for the first time. Where do you aim? For the middle of the disk as you approach it? Aim for the edge and you may miss altogether. That doesn't work for Mars where an oblique entry at the edge of the disk is needed to get a long path through the thin atmosphere for braking. So, where was the middle of the disk during approach? This map reveals all. It's just the previous map in a different orientation.
#maps #venus
My last post showed where Venera 3 entered the atmosphere of Venus, with the surface mapped as we know it now. At the time this was utterly unknown. This region was not even in the area covered by those radar images. But let's look closer anyway. This map shows the middle part of that ellipse, mostly occupied by Manatum Tessera, a broad hilly area cut by many fractures. The 'undae' feature at top left is sand dunes, the corona features are volcanic complexes.
#maps #venus
@PhilStooke Phil, that's a profound philosophical question, but I think you've reached the most pragmatic of conclusions.
@birchbirch I have another such conundrum which comes up repeatedly when considering which bodies have been mapped, or which was the first map of any given body: how much has to be included in a map for it to be a map? If only one thing is known to exist (such as a dark spot on a brighter background), is a depiction of it a map? I say yes: the first map of Titan was just that, as is the first map (a temperature map) of an exoplanet.