I now implemented a per-thread #pool to reuse #timer objects in #poser (my lib I use for #swad).
The great news is: This improved performance, which is an unintended side effect (my goal was to reduce RAM usage 🙈😆). I tested with the #kqueue backend on #FreeBSD and sure, this makes sense: So far, I needed to keep a list of destroyed timers that's always checked to solve an interesting issue: By the time I cancel a timer with #kevent, the expiry event might already be queued, but not yet read by my event loop. Trying to fire events from a timer that doesn't exist any more would segtfault of course. Not necessary any more with the pool approach, the timer WILL exist and I can just check whether it's "alive".
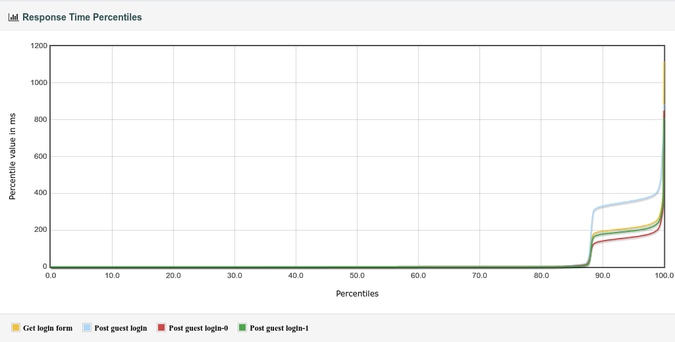
The result? Same hardware as always, and now swad reaches a throughput of 26000 requests per second with (almost) perfect response times. 🥳
I'm still not happy with memory usage. It's better, and I have no explanation for what I oberved now:
Ran the same test 3 times, 1000 #jmeter threads each simulating a distinct client running a loop for 2000 times doing one GET and one POST for a total of 4 million requests. After the first time, the resident set was at 178MiB. After the second time, 245 MiB. And after the third time, well, 245 MiB. How ...? 🤯
Also, there's another weird observation I have no explanation for. My main thread delegates accepted connections to worker threads simply "round robin". And each time I run the jmeter test, all these worker threads show increasing CPU usage at a similar rate, until suddenly, one single thread seems to do "more work", which stabilizes when this thread is utilizing almost double the CPU as all other worker threads. And when I run the jmeter test again (NOT restarting swad), the same happens again, but this time, it's a *different* thread that "works" a lot more than all others.
I wonder whether I should accept scheduling, memory management etc. pp are all "black magic" and swad is probably "good enough" as is right now. 😆


