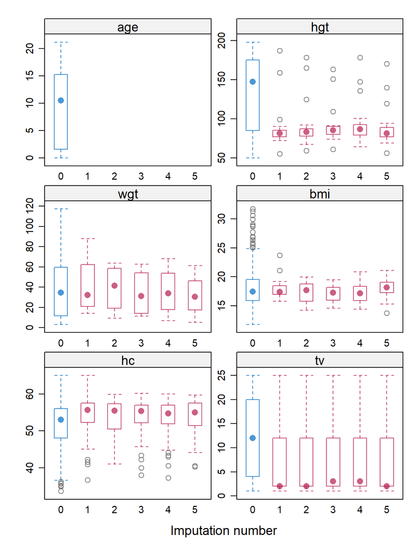
When performing multiple imputation of missing data, it is essential to evaluate how the imputed values compare to the observed data.
The attached image, created with the bwplot() function, showcases how the distributions of observed and imputed values vary across different imputations for multiple variables.
Detailed information: http://eepurl.com/gH6myT