I'm trying to graph out some hypotheses that result from a statistical model with #mermaidjs. Trying to do it kinda DAG-style, but I'd really like to be able to visualise the interactions by having arrows from nodes to edges (see issue on GH https://github.com/mermaid-js/mermaid/issues/3425). Do #stats / #rstats people not do this? Or if so, how/where do you make such graphs? Any examples? I had to add the extra arrow manually for now.
Pointing to a line · Issue #3425 · mermaid-js/mermaid

Hi. I am a big fan of mermaids and as a graduate student I want to do research with quantitative research methods. At first I thought I thought I could draw a research model with mermaids, but I fo...

GitHub

@roaldarboel
You can represent this as
node1 --> edge1
edge1 --> node2
node1 --> edge2
edge2 --> node3

node annotating an edge

node3 --> edge3
edge3 --> edge1
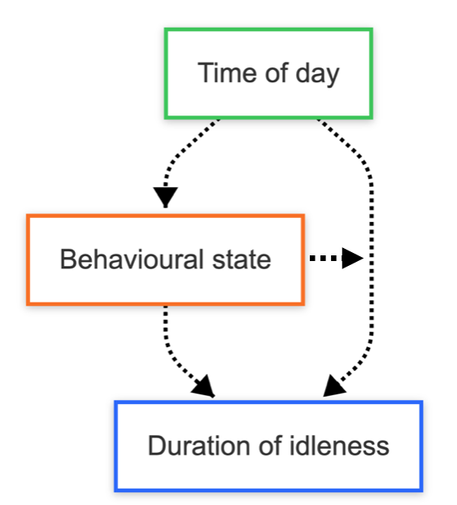
@jonny Are you able to make this approach work in Mermaid or similar though?
@roaldarboel
Ya ya. That is mermaid syntax. Should work anywhere, the idea is basically adding another level of nodes that represent edges, which is a standard graph trick. "Just add more nodes"
@roaldarboel
(Use mermaid classes to style them differently)
@jonny So basically just make a node at the intersection? Feels hacky… and not in the good way 😂
@jonny Would wish there was something simple like A —> BC 🫠
@roaldarboel
If only. Problem is there can be multiple edges between B and C, so an edge needs to be given a unique identifier. That just so happens to align with being a node in most graph markup syntaxes. See RDF-Star on the challenges of annotating edges
@jonny Damn. Why does this always happen - discovering an existential problem of our entire knowledge system when all I wanted was a line pointing to a line 😅😂