🚨 A reminder that even though #Alabama hasn't expanded Medicaid, 9.3% of the state's residents are still facing SKYROCKETING #ACA insurance premiums starting in January if IRA subsidies aren't extended by Congress.
That's 477,000 people statewide.
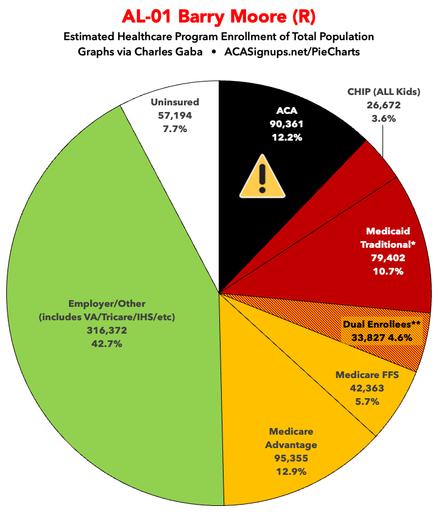
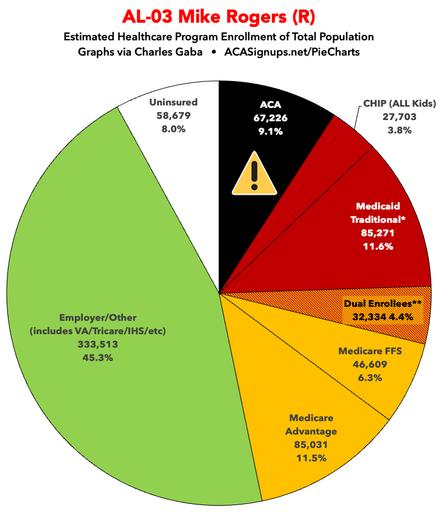
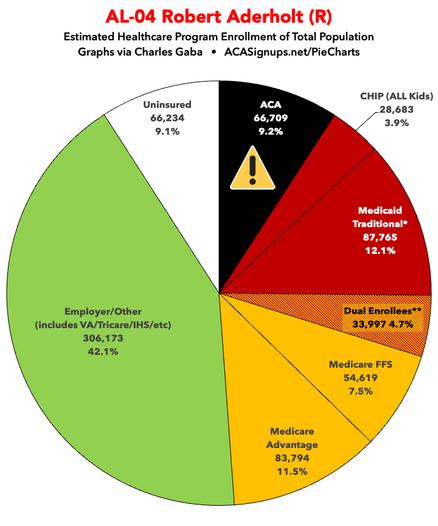
You can find these pie charts for all 435 House districts & all 50 states +DC here along with high-res PDF versions suitable for printing!
(note: these versions don't include the scary warning symbol; they're pure data)
acasignups.net/piecharts
Bringing Pie Charts to a Knife...
Bringing Pie Charts to a Knife...

Bringing Pie Charts to a Knife Fight: Medicaid, ACA & Medicare enrollment by House District! (updated)
Originally posted 2/26/25 Political battles are usually won based on appealing to emotion, not to facts, policy or logic. However, you should still have those facts at your disposal for two reasons: First, they still help you craft appeals to emotion. Second, they also help you craft the actual policy. Besides, I'm a data guy; my primary job is to help put facts & policy into easily-understandable context. Over the past couple of months I've compiled a master spreadsheet breaking out enrollment in ACA plans (Qualified Health Plans & Basic Health Plans), Medicaid/CHIP coverage (both traditional & via ACA expansion) and Medicare (both Fee-for-Services & Advantage) at the Congressional District levels. As noted in the methodology for each, there's a small amount of fuzziness in some of the numbers for a couple of reasons, the main one being that the "as of" date varies depending on the type of coverage--Medicaid/CHIP total numbers are as of last October, while ACA Expansion Medicaid is as of last June; Medicare data is as of September 2024; and ACA exchange QHPs/BHPs are as of January 2025.