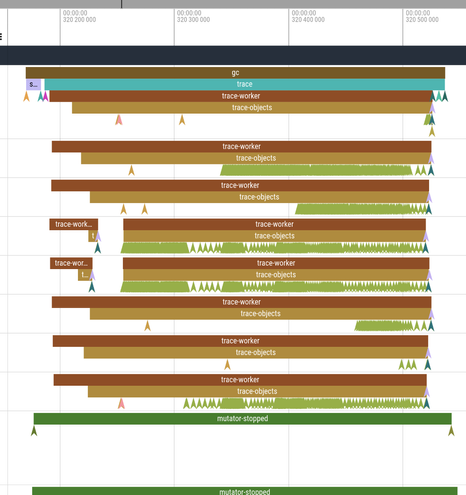
a minor collection in a whippet microbenchmark, 16MB total nursery:
. 366µs total pause time
. 12µs to get the 8 mutators to stop
. every green arrow is one object stolen from a remote chase-lev deque
. a couple workers ran out of work after 42µs and restarted 25µs later when more work was available

traces via https://lttng.org's user-space tracing; output munged by a script so that i could load in perfetto / chrome-tracing's UI

LTTng: an open source tracing framework for Linux

LTTng is an open source tracing framework for Linux. Gain insight into your system's behavior today.

LTTng
@wingo are you happy with the perfetto ui, compared to, say, the chrome thing? Or the Firefox profiler ui?
@cfbolz i don’t actually see perfecto and the chrome thing as different; or at least i have not used the enough to have an opinion
@cfbolz no experience with firefox’s, i should look into that
@wingo it's more profiling-oriented, maybe? I haven't tried perfetto 😅
@cfbolz my impression (completely retconned, no knowledge) is that chrome:tracing was a wonderful one-page hack, that was so good they put a team of people on it, it became an android product and now is full of protobufs; but the web ui is the same as it ever was.
@cfbolz i.e. the ui is now only one part of perfetto, they spend more time getting the data, and the main target is now android rather than the web. but again this is all retconned :)
@wingo I quite enjoy the firefox profiler, we generate json for it from python profiles. only thing I'm really missing is a nice call graph view, like kcachegrind has it: https://kcachegrind.github.io/html/Shot3Large.html
KCachegrind

@cfbolz i dearly love kcachegrind :) honestly that any profiling tool exists at all is a miracle, these things are so ephemeral; you fix your bug and move on, leaving half-finished perf analysis tools to rot

@wingo yeah, it seems like a hard problem, PyPy's profiler is also in a bit of a weird state always, and our former ui is just gone.

I really don't get why nobody that I can find has done a graphviz based call graph though, like kcachegrind has it. It such a super useful tool.

Read the profiler snapshot | PyCharm

PyCharm Help
@smarr @wingo goes in the right direction for sure!

@cfbolz @wingo have you tried MMTk’s tracing support? We also output in the JSON tracing format supported by Perfetto. https://github.com/mmtk/mmtk-core/tree/master/tools/tracing

Kunshan has written a case study using the tracing tools for performance debugging https://wks.github.io/blog/2023/10/04/proved-me-wrong.html

mmtk-core/tools/tracing at master · mmtk/mmtk-core

Memory Management ToolKit. Contribute to mmtk/mmtk-core development by creating an account on GitHub.

GitHub
@caizixian @cfbolz nice, will look! enjoyed the paper, btw!
@wingo @cfbolz I’m glad you enjoyed it. It was led by Claire as one of her undergraduate research projects. Very impressive work.