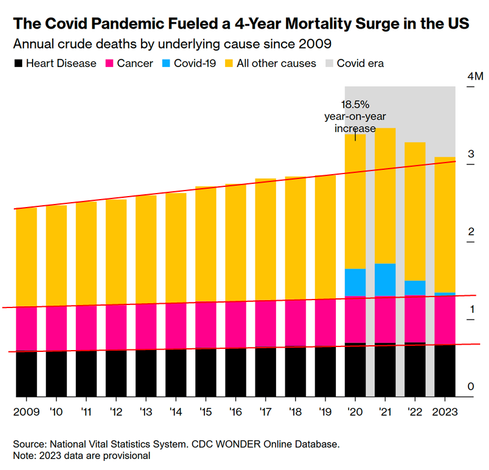
How the Pandemic Increased US Deaths Visualized in Eight Charts

There is a clear increase in mortality, particularly in 2020 and 2021, this reduces in 2022 and has not yet returned to the baseline trend in 2023. Not all mortality was likely counted as COVID-19-related. Cancer was stable.
1/9

As seen, but less clearly, on the first graph, there was an increase in heart disease. Infections put extra strain on the body, especially the heart and underlying heart issues can be enhanced by infectious diseases. With immune memory in place, this effect is reduced.
2/9
Similarly to heart disease, stroke and diabetes incidence rise during infections. This is again the extra strain put on te body by a heavy infection. These reduce with immune memory in place. The reduction in AD is harder to explain. Infections will also speed up AD.
3/9
As a result of the coinciding opioid crisis, poisonings were up during the pandemic period, but not directly related to the viral infections. The consequences do make an impact on general health, including mortality numbers.
4/9
@marc_veld
I wonder how many of those "poisonings" during the #Covid #pandemic were due to idiots eating horse skin cream (ivermectin), fish tank cleaner (hydroxychloroquine) or injecting bleach into their bodies by antivaxers listening to crank "cures" being touted by RWNJ's?