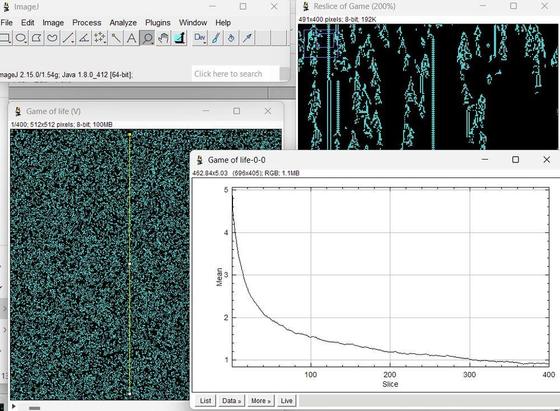
Hehe, the first game of life I code (in #FijiSc
using #BigDataViewer
obviously). Naive implementation, but still functionally defined and lazy computed - see how the data arrives as I scroll, and is cached.
Now I can do ImageJ stuff, like reslice and look for the game of life intensity decay over time (it bleaches!) Does anybody know what's the theoretical curve ? It's probably known right ? ( with a 50/50 live dead random start )
Replace t with z -> and now we have a nice view of the game of life dynamics
This Game of Life is computed by tile, and lazily (you compute only what has to be displayed). What's cool about it is that you can pause computation and see what has been computed so far. For instance, if you request a small tile late in time, you can see the 'causal cone' of the computed tile: