#30DayMapChallenge #BundesagenturfürArbeit

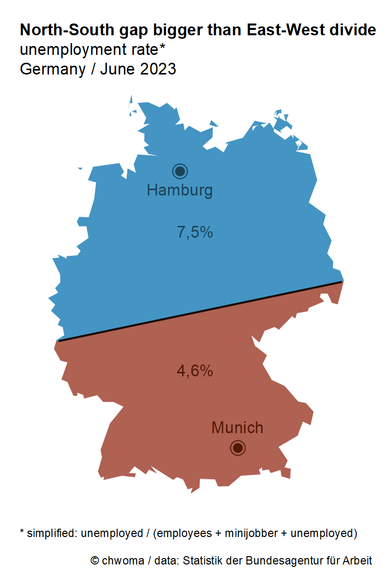
day 3 – Polygons: North-South gap bigger than East-West divide

To calculate a (simplified) unemployment rate, you need data for the unemployed and the employed. These are available at https://statistik.arbeitsagentur.de for more than 10,000 German communities. I calculated two figures: one for the northern and one for the southern polygon.

Did you expect that the gap between North and South is bigger than between East (7,7%) and West (5,8%)?

Startseite - Statistik der Bundesagentur für Arbeit

Homepage des deutschsprachigen Auftritts

@chwoma would you mind elaborating which tools you used to calculate the aggregates as well as the equator itself?
@wahlatlas No, I don't mind at all. It's still my aim to share all the code & data for the maps. (I'm struggeling a bit with GitHub rightnow).
I did the plot in (base) #rstats and used the sf package. I got the polygons via the st_voronoi function.

@chwoma

Now please factor in the stay-at-home housewifes of the "traditional" partriarchial household of the South vs. working women in the East. I think that could be a major factor.

@chwoma Seems logical considering the north has almost all of the east?

@selulven Yes, the East is largely part of "the North". But the gap between North and South is bigger than between East and West.

My point is: East and West are different in many ways. Concerning unemployment they are not so different anymore.

The relatively low unemployment in West Germany is mainly due to the Southern Länder.

@chwoma But the Eastern part of Germany, where unemployment is high, is almost completely part of the northern polygon. So your numbers are deceptive.