The Trillion Dollar Question Nobody is Asking
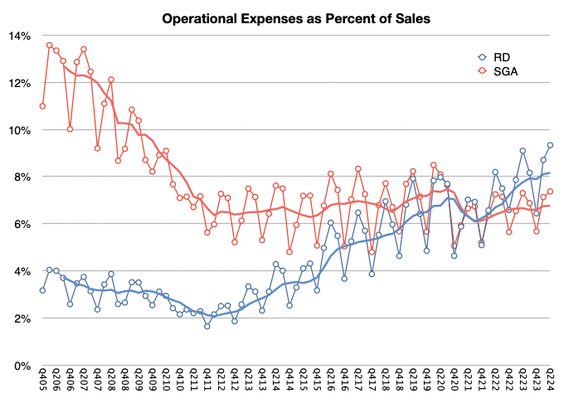
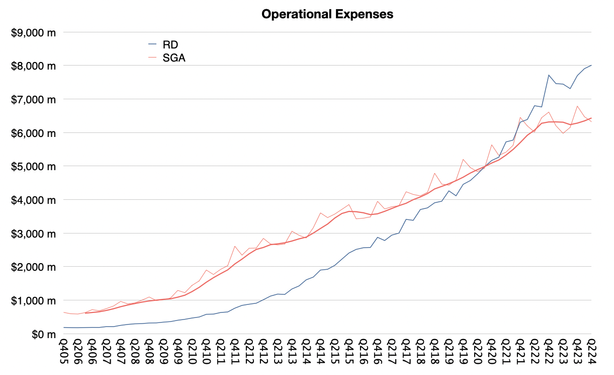
Apple Investors are keen observers of metrics of financial performance. We have to track top line, bottom line and many lines in between. Updates to the data are delivered every quarter through official documents such as the 10K and statements made in conference calls. These data are then analyzed and opinions are formed on the viability, sustainability, and prospects for the company.
https://www.asymco.com/2024/09/08/the-trillion-dollar-question-nobody-is-asking/