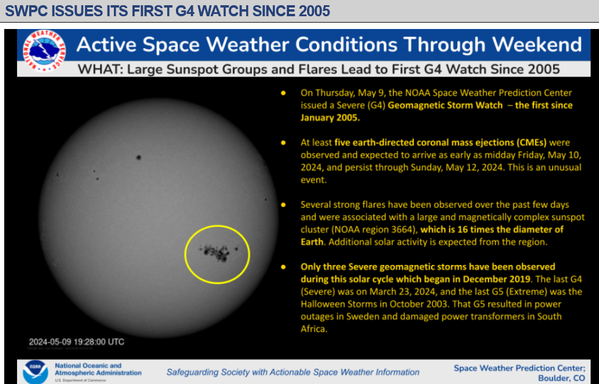
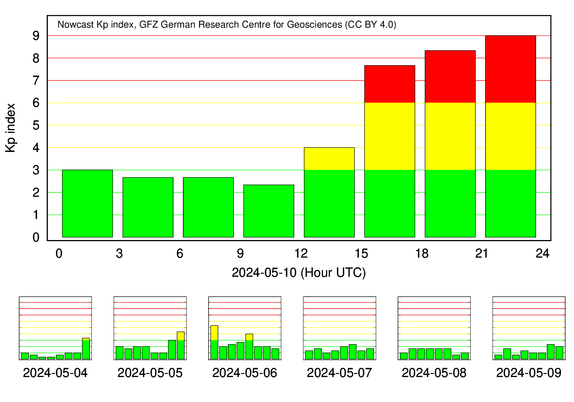
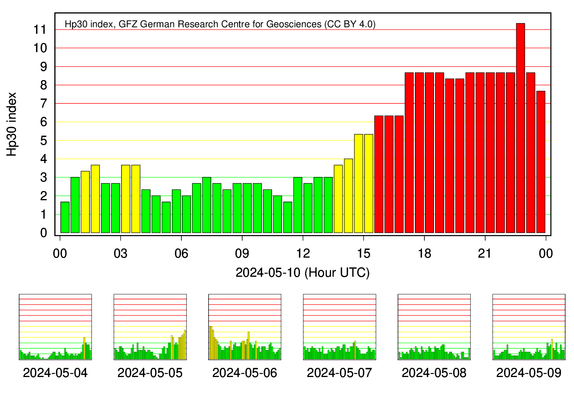
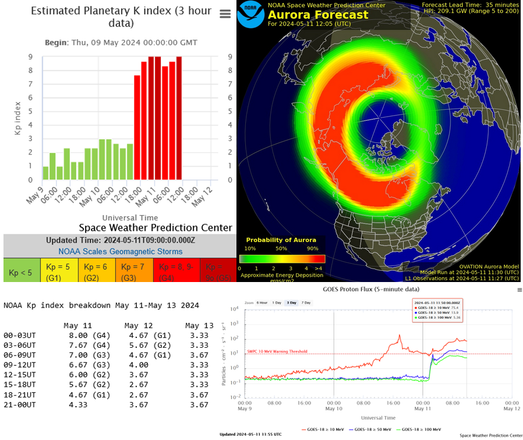
Incoming! A severe G4 Geomagnetic Storm is expected to arrive around 02:00 UTC Friday night / Saturday morning.

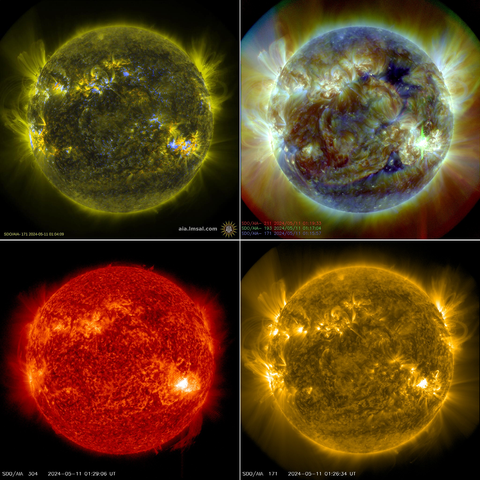
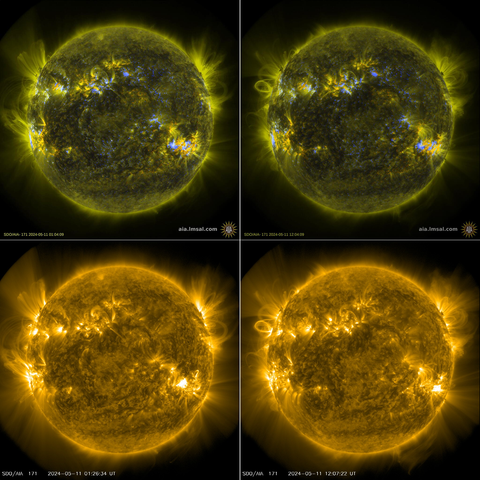
At least 5 Coronal Mass Ejections took place over the past 24 hours, directed towards Earth. These originated from a large and magnetically complex sunspot cluster (NOAA region 3664).

There is potential for disruption of communications, the electric power grid, navigation, radio and satellite operations.

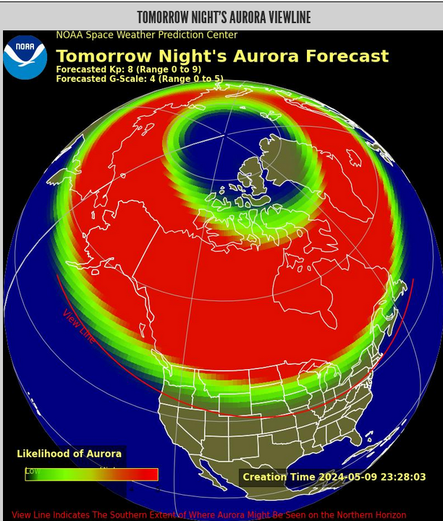
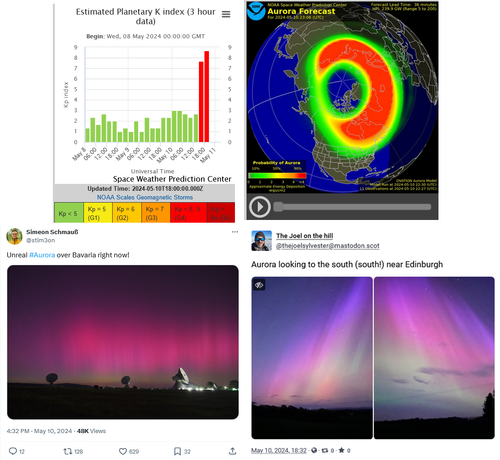
And bright auroras as far south as Alabama!

https://www.swpc.noaa.gov/
1/n

Homepage | NOAA / NWS Space Weather Prediction Center

The CMEs ejected by the Sun are headed for earth, as shown in the stills from the animation at NOAA. The big merged CME should be here around 02:00 UTC Friday night / Saturday morning, which means good Aurora viewing for those in North America.

https://www.swpc.noaa.gov/communities/space-weather-enthusiasts-dashboard
2/n

Space Weather Enthusiasts Dashboard | NOAA / NWS Space Weather Prediction Center

Here is the Aurora forecast for tomorrow night for N. America.

Let's hope that the Aurora viewline dips further south.

https://www.swpc.noaa.gov/products/aurora-viewline-tonight-and-tomorrow-night-experimental
3/n

Aurora Viewline for Tonight and Tomorrow Night (Experimental) | NOAA / NWS Space Weather Prediction Center

Let's keep in mind that we are approaching the peak of the current 11-year solar cycle #25. Hence, the increase in the number of sunspots, solar flares and CMEs in the past year. And there will more such events over the course of the next year.

We have experienced stronger cycles in the recent past as shown in the graph below. This cycle seems to be acting stronger than predictions and peaking earlier.

https://www.swpc.noaa.gov/communities/space-weather-enthusiasts-dashboard
https://en.wikipedia.org/wiki/Solar_cycle
4/n

Space Weather Enthusiasts Dashboard | NOAA / NWS Space Weather Prediction Center

To relax before the G4 solar storm arrives, please take a look at this fascinating time-lapse video of the surface of the Sun. The video was created using images taken by NASA’s Solar Dynamics Observatory SDO,.

Beautiful and frightening as it may appear, it is what provides the energy to sustain life on earth. The earth's magnetic field helps deflect dangerous flares and energetic particles away from earth and our atmosphere, and allows the good stuff to pass thru.

https://youtu.be/6tmbeLTHC_0
5/n

NASA | Thermonuclear Art – The Sun In Ultra-HD (4K)

YouTube

Peak Geomagnetic Activity is expected between 06 and 09 UTC with a Kp Index of 8.33 (G4 on the G-Scale).

"The K-index quantifies disturbances in the horizontal component of earth's magnetic field with an integer in the range 0-9 with 1 being calm and 5 or more indicating a geomagnetic storm.

The label 'K' comes from the German word 'Kennziffer' meaning 'characteristic digit.' The K-index was introduced by Julius Bartels in 1938."

https://www.swpc.noaa.gov/communities/aurora-dashboard-experimental
https://www.swpc.noaa.gov/products/planetary-k-index
6/n

Aurora Dashboard (Experimental) | NOAA / NWS Space Weather Prediction Center

The largest magnetic storm of the last century occurred on 13 March 1989. Its effects included -
- A 9-hour outage of the Hydro-Québec power system.
- Significant interference to the U.S. power grid
- Several satellites lost control for several hours including GOES and NASA's TDRS-1.
- Orbit changes for 2500+ satellites
- Space Shuttle Discovery suffered a malfunction in a sensor on a hydrogen tank.

https://agupubs.onlinelibrary.wiley.com/doi/10.1029/2019SW002278
https://en.wikipedia.org/wiki/March_1989_geomagnetic_storm
@mastodonmigration
7/n

The other more recent major event was the Halloween solar storms of 2003.

A series of solar flares and CMEs from mid-Oct to early Nov, peaking around Oct 28–29, caused wide ranging impacts -
- Power outages in Sweden
- ~59% of the Earth and Space science missions were impacted.
- Temp failure of the SOHO satellite
- Damage to the Advanced Composition Explorer (ACE)
- Loss of ADEOS-2 satellite
- A majority of LEO satellites were temporarily lost
- Orbit changes

https://www.weather.gov/media/publications/assessments/SWstorms_assessment.pdf
8/n

Here is an insightful graphic on Heliophysics and Space Weather from NASA that requires little explanation.

https://svs.gsfc.nasa.gov/30481/
9/n

NASA Scientific Visualization Studio | Heliophysics and Space Weather

The sun and its atmosphere consist of several zones, or layers, from the inner core to the outer corona. Beyond the corona is the solar wind, which is an outward expansion of coronal plasma that extends well beyond the orbit of Pluto. This entire region of space influenced by the sun is called the heliosphere. Controlled by the Earth’s magnetic field, the magnetosphere acts as a shield protecting the planet from solar wind. The shape of the Earth's magnetosphere is the direct result of being impacted by solar wind, compressed on its sunward side and elongated on the night-side, the magnetotail. The shock wave where the solar wind encounters Earth's magnetosphere is called the bow shock, which slows and diverts the solar wind. Solar activity lead to solar eruptions, which includes such phenomena as sunspots, flares, prominences, and coronal mass ejections that influence space weather, or near-Earth environmental conditions. Modern society depends heavily on a variety of technologies that are susceptible to space weather. CMEs for example can cause geomagnetic storms that can disrupt satellite communications and navigational equipment, and even cause blackouts. ||

NASA Scientific Visualization Studio

Here is an interesting artist's conception of a Heliophysics Map as it might have been drawn during the times of Columbus and other ancient explorers 😜

https://svs.gsfc.nasa.gov/4526/
10/n

NASA Scientific Visualization Studio | Ye Olde Tyme Heliophysics Map

Basic Olde Tyme Heliophysics Map. || OldeTimeHelioMapv4_print.jpg (1024x574) [245.1 KB] || OldeTimeHelioMapv4_searchweb.png (320x180) [110.2 KB] || OldeTimeHelioMapv4_thm.png (80x40) [7.6 KB] || OldeTimeHelioMapv4.tif (7819x4386) [98.1 MB] || OldeTimeHelioMapv4.key [98.8 MB] || OldeTimeHelioMapv4.pptx [6.5 MB] || If Columbus had been a heliophysicist, what maps would he have consulted? Here's some artist conceptions of our solar system might be presented for our explorations. ||

NASA Scientific Visualization Studio

A summary of how space weather affects spacecraft and satellites.

Single event effects (SEE) cause bit flips in memory, FPGAs, CPUs, ...

Increased spacecraft drag and orbital decay due to the thermal expansion of the Earth’s upper atmosphere during space weather storms.

Attitude control disruptions caused, e.g., by large storm-time magnetic field fluctuations can lead to loss of cmd & control.

And there are lot more satellites in LEO now than in 2003 😨

https://ccmc.gsfc.nasa.gov/RoR_WWW/SWREDI/2014/SWimpacts_YZheng_060914.pdf
11/n

Image captured by NASA’s Solar Dynamics Observatory of the strong X3.9 solar flare, that peaked at 2:54 a.m. ET today.

"The image shows a subset of extreme UV light that highlights the extremely hot material in flares and which is colorized in gold."

https://blogs.nasa.gov/solarcycle25/2024/05/10/strong-solar-flare-erupts-from-sun-13/
Credit: NASA/SDO
12/n

Strong Solar Flare Erupts from Sun - Solar Cycle 25

The Sun emitted a strong solar flare, peaking at 2:54 a.m. ET on May 10, 2024. NASA’s Solar Dynamics Observatory, which watches the Sun constantly, captured

Empty Test

Here are some more mesmerizing pics of the Sun's agitated surface this week, captured by NASA’s Solar Dynamics Observatory.

The spacecraft is stationed in a Geosynchronous orbit (altitude 35,786 km) at 102° West.

Note that these magnetic eruptions and curves are huge!
Sun diameter: 1,391,000 km
Earth diameter: 12,760 km

https://svs.gsfc.nasa.gov/14588
Credit: NASA/SDO
13/n

NASA Scientific Visualization Studio | May 2-9, 2024 : A Busy Week of Flares

NASA’s Solar Dynamics Observatory captured this imagery of solar flares – as seen in the bright flashes on the upper center – on May 2, 2024. The image shows a blend of 171 Angstrom and 131 Angstrom light, subsets of extreme ultraviolet light. Credit: NASA/SDO || 5-2-2024_2000_to_5-3-2024_1034_171-131.2024-05-03_07_24_21.gif (500x500) [4.9 MB] || 5-2-2024_2000_to_5-3-2024_1034_171-131.mp4 [39.3 MB] ||

NASA Scientific Visualization Studio

If the Sun is shining where you are, you might be able snap a memorable shot like this of the Sun and the NOAA 3664 sunspot region using the filter that was used to watch the solar eclipse on April 8!

Let's give it a shot 📷

14/n

It appears that G4 levels have been reached already, a Kp index of 7.66 is being reported by NOAA SWPC.

Aurora forecast for the next 30 minutes for northern Europe is bright red now.

Get those cameras ready; there is lot more to come ...

https://www.swpc.noaa.gov/
15/n

Homepage | NOAA / NWS Space Weather Prediction Center

Here is a website in Ireland with good space weather data and aurora forecasts for Europe.

@vonneudeck
https://www.magie.ie/aurora/
https://www.magie.ie/data/
16/n

Aurora Forecast – MagIE

It's happening! Aurora sightings being reported from Europe.
Just search for "aurora" on twitter or Mastodon.

Visit this website for lots of images posted in real-time in Germany -
https://www.foto-webcam.eu/

Also, see posts and boosts by @AstroMigration

Kp index now above 8.
N. America is in for a treat in the next few hours.

@stim3on
#SolarStorm #Aurora #cme
17/n

Webcam-Übersicht - Foto-Webcam.eu

Foto-Webcam.eu: Die Webcams mit der besten Bildqualität bei Tag und Nacht

We are now in G5 territory! Both NOAA and the GFZ in Potsdam are reporting Kp index at 9 (G5). GFZ is the source of the index. This is happening far earlier than predicted. G5 conditions were first observed at Earth at 6:54 p.m. EDT (22:54 UTC).

Let's hope we get a terrific light show tonight and nothing more 🤞.

https://kp.gfz-potsdam.de/en/figures/kp-daily-plots
18/n
#SolarStorm

Kp daily plots - Kp index

Here is a more granular version of the geomagnetic Kp Index called Hp30.

It has a time resolution of 30 minutes instead of 3 hours and its value is not capped at 9.

The highest Hp30 value measured today was 11.3!

The Hpo index was developed in the H2020 project SWAMI. There is an Hp60 index as well with an averaging period of 60 minutes.

https://kp.gfz-potsdam.de/en/hp30-hp60/daily-plots
19/n

Daily plots - Kp index

The serene/ferocious Sun ... just moments ago ... as imaged by the NASA Solar Dynamics Observatory (SDO) in various wavelengths.

Any CMEs from region 3664 in the next few days will not strike earth as the region (at the 4 o'clock position) is rotating away from us. But other sunspot regions may become more active and start lobbing CMEs at us

https://sdo.gsfc.nasa.gov/data/
20/n

It's been quite an experience for many who got to see and photograph the aurora borealis last night in shimmering magenta and green colors.

No major reports of damage or disruptions.

It's not over yet. The Kp index has stayed above 8 for over 15 hours. It hit 9 again (G5) this morning. It is forecast to decline steadily over the day but rise again to around 6 tonight.

Search for "aurora" and "solar storm" to see the wonderful images taken by the good folks here.

https://www.swpc.noaa.gov/
21/n

Homepage | NOAA / NWS Space Weather Prediction Center

There is still a lot of activity on the frothing surface of the Sun.

Here are two sets of images taken by the Solar Dynamics Observatory (SDO) 11 hours apart. Notice the new loop at the 10 o'clock position.

There was another high energy X5.4 flare last night from the 3664 sunspot region at the 4 o'clock position, but not directed at earth.

You can see near-real-time images and time-lapse videos of the Sun at
https://sdo.gsfc.nasa.gov/data/
22/n

Sun and Earth, by XKCD.
And us Humans in between, enjoying its life-sustaining warmth. And Auroras.

Title text: "But we don't need to worry about the boiling masses sandwiching the thin layer in which we live, since we're so fragile and short-lived that it's unlikely to kill us before something else does! Wait, why doesn't that sound reassuring?"

https://xkcd.com/2004/
https://www.explainxkcd.com/wiki/index.php
23/n

Sun and Earth

xkcd

Here is an image of last night's aurora over N. America as seen from space at 0658 UTC.

The image was taken by the Visible Infrared Imaging Radiometer (VIIRS) instrument onboard the NOAA-20 satellite, using its Day Night Band sensor (DNB).

The VIIRS DNB can image at very low levels of light at night in wavelengths between 0.5 – 0.9 µm (visible and some near-IR).

Most aurora emissions are at 90-150 km, but the reds last night were likely from higher altitudes.

https://cimss.ssec.wisc.edu/satellite-blog/archives/59112
24/n

Aurora over the northern United States

The Space Weather Prediction Center (link) has recently noted strong solar activity as part of the ongoing solar maximum (see the images below from 10 May and 11 May). The result on 11 May was an aurora borealis observed south into the United States. The Day Night Band image above, from Suomi-NPP, shows the light […]

@AkaSci

MORE MORE OF THIS!

Photos of specific energy levels and spectrum!?! Yes, yes please.