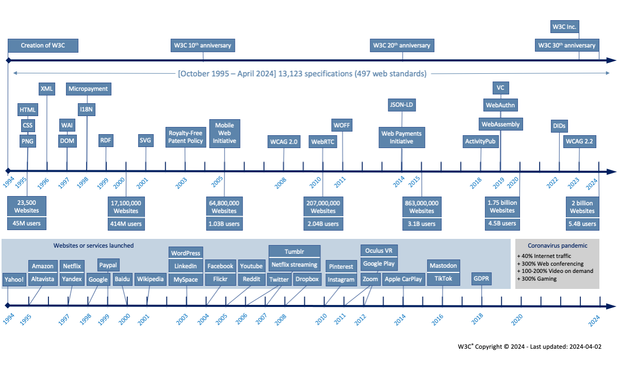
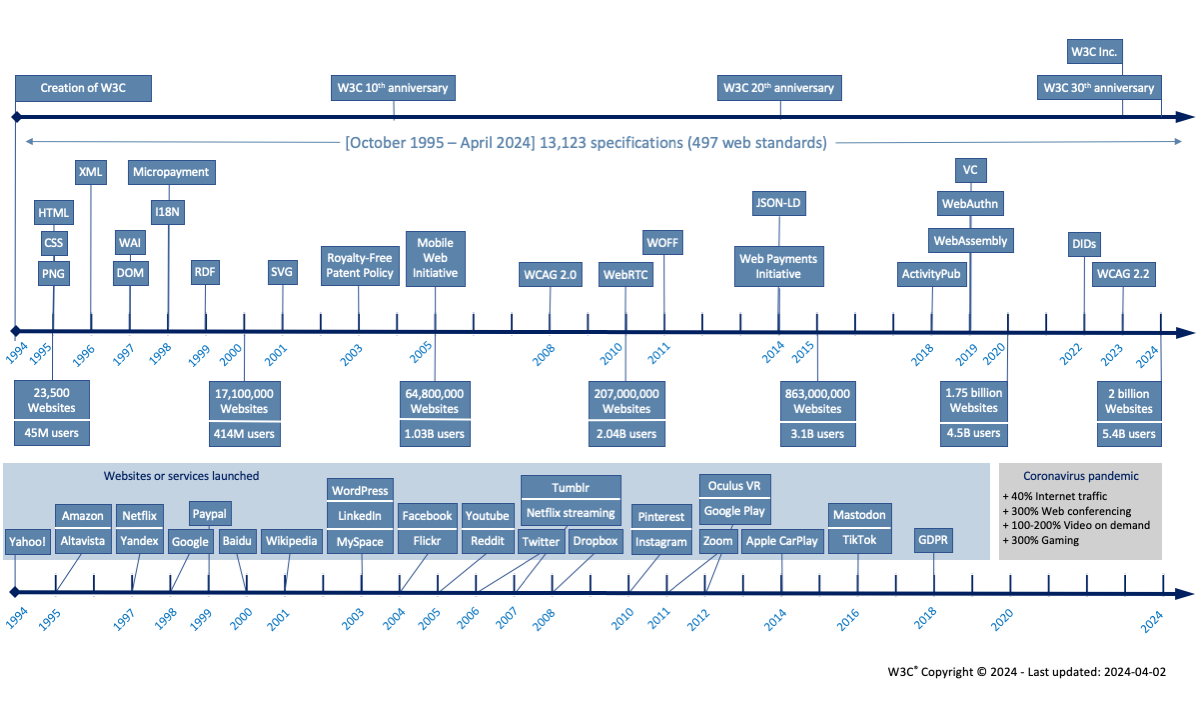
Today I updated the visual 1994-2024 timeline of @w3c organizational highlights and most notable technical work.
For additional context I added the number of websites and Internet users every few years, as well as a layer noting a selection of other sites, products or services.
It's a lot of data in one representation 🤓
https://www.w3.org/comm/assets/graphics/2024-04-02_timeline-1994-2024/2024-04-02_timeline-1994-2024.html