#30DayMapChallenge #rstats #Arbeitsmarktstatistik
day 26 - Minimal: digital beermat
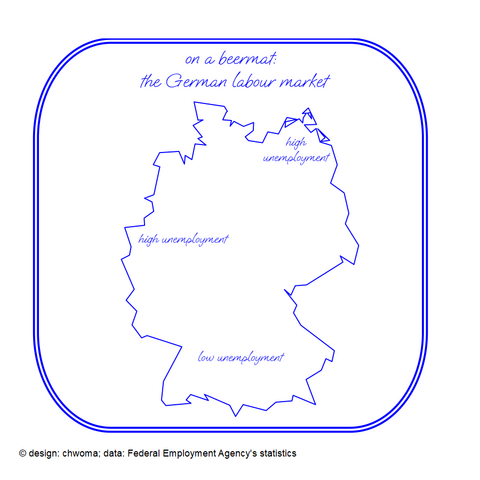
Going back to day 5 I created a digital version of the beermat analysis of the German labour market.
Thanks to the R-package showtext it has become easy to use fonts in R graphs: https://CRAN.R-project.org/package=showtext

showtext: Using Fonts More Easily in R Graphs
Making it easy to use various types of fonts ('TrueType', 'OpenType', Type 1, web fonts, etc.) in R graphs, and supporting most output formats of R graphics including PNG, PDF and SVG. Text glyphs will be converted into polygons or raster images, hence after the plot has been created, it no longer relies on the font files. No external software such as 'Ghostscript' is needed to use this package.