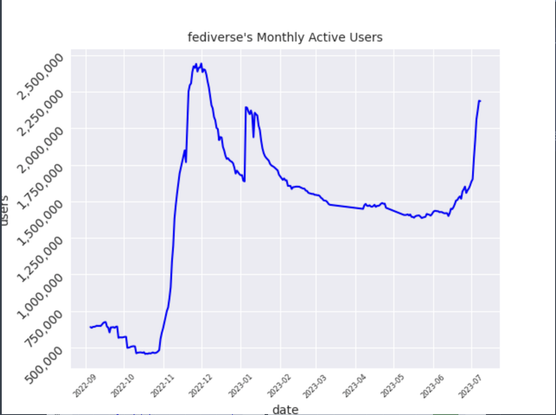
@Fragglemuppet @tchambers the image shows a line graph. The X axis is dates (starting at September 2022, up to today, in 1 month steps), the Y axis is users (starting at 500000, up to 2.5 million, in steps of 250000)
The earliest point in the graph shows about 600000 users, which gradually fell to 500000 close to November 2022, which is immediately followed by the largest peak in the graph, with nearly 2.4 million users. By early December 2022, the numbers start to fall (cont.)