This is not normal.
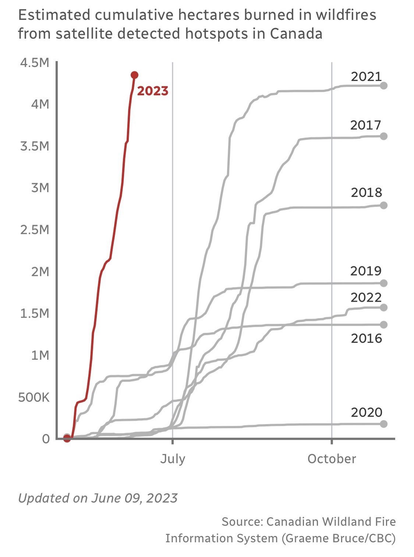

Perspective on the scale of #CanadaWildfires with #CopernicusAtmosphere GFAS data https://confluence.ecmwf.int/display/CKB/CAMS+global+biomass+burning+emissions+based+on+fire+radiative+power+%28GFAS%29%3A+data+documentation showing the fire locations/intensity across the country & the incredibly steep increase in emissions since 1 May (up to 9 June) compared to 2003-2022 #wildfire #IIFF
@og_of_bashan @jcdenton @davidho
Republican & OPEC billionaires funded climate denial for decades
https://slate.com/technology/2015/12/exxonmobil-koch-family-have-powered-climate-change-denial-for-decades.html
https://orionmagazine.org/article/koch-network-climate-change-misinformation/
https://www.vice.com/en/article/n7zqxm/how-koch-industries-fake-scientists-and-rush-limbaugh-invented-climate-denial
https://www.bbc.com/news/science-environment-58982445
https://www.opendemocracy.net/en/dark-money-investigations/global-warming-policy-foundation-net-zero-watch-koch-brothers/
https://unearthed.greenpeace.org/2021/10/21/leaked-climate-lobbying-ipcc-glasgow/
OPEC's advice to the UN is "More oil!"
https://www.energyconnects.com/news/oil/2023/february/opec-chief-tells-climate-activists-to-look-at-the-big-picture/
https://foreignpolicy.com/2021/06/16/climate-goals-opec-oil-prices-energy-crisis-shortages-fossil-fuels/
Oil producers are cynically appointed to head climate summits
https://www.reuters.com/world/middle-east/uae-names-adnoc-chief-jaber-cop28-climate-conference-president-2023-01-12/
https://www.bbc.com/news/world-middle-east-64269436
