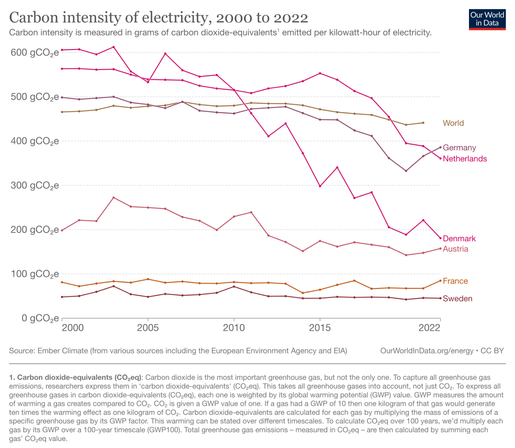
This is a nice race to follow: the evolution of carbon intensity of electricity.
Before 2010 Denmark and the Netherlands were still higher than world average. Then from 2010 Denmark got serious about decarbonising. In the Netherlands we waited until 2018 but we are finally reducing it quickly!
In 2022 it was lower than Germany for the first time. Germany's carbon intensity increased in the last 2 years.
Still a long way to go to reach France and Sweden at the bottom.
Final goal 0!
CO2 emissions per person in the world peaked in 2012 and are rather stable since then.
In the EU it is decreasing but it is still higher than the world average.
The fact that the EU uses less than half CO2 per person than the US is actually a good example for me that you can have a better quality of life and less CO2.

@DewiLeBars Interesting!

Why the sudden drop for the US in the very late 1970s? Oil crisis? Carter policies?

Why did the world's carbon intensity stop increasing so rapidly around the same time?

Why the drop for the US around 2005?

Why the big increase in the EU after 2000? Entry of new, more coal-intensive countries?

@peterdrake many difficult questions 😅
The oil crisis probably played a role, is it also the time coal started to be used less?
Then the later drop around 2005 might be related to the subprime crisis that was 2007.
The EU carbon intensity didn’t increase after 2000 it continues to go down but China passes the EU then.
@DewiLeBars Oh, sorry, I was looking at the China line, not EU. That's the one that goes up sharply in the 2000s.
@DewiLeBars This is only half of the story, the other half of global warming comes from other gases that are not tracked by Our World in Data.

@jknodlseder that is right. They also have other GHGs at Out World in Data. This is methane:

https://ourworldindata.org/grapher/per-capita-methane-emissions?tab=chart&country=CHN~USA~OWID_WRL~OWID_EU27

Per capita methane emissions

Per capita methane emissions are measured in tonnes of carbon dioxide-equivalents per person per year.

Our World in Data

@jknodlseder @DewiLeBars The 'known unknowns' and 'unknown unknowns' really matter, I agree. Reminds me of the recent case of Kazakhstan, although it's odd to shed so much light on particular places only.

💥 https://www.theguardian.com/environment/2023/mar/06/revealed-1000-super-emitting-methane-leaks-risk-triggering-climate-tipping-points

Plus, Our world in Data is keen on pushing the Green Growth and Decoupling narratives. Not sure if they hold up against these complexities.

Revealed: 1,000 super-emitting methane leaks risk triggering climate tipping points

Vast releases of gas, along with future ‘methane bombs’, represent huge threat – but curbing emissions would rapidly reduce global heating

The Guardian

@DewiLeBars

True.

High energy demands are not a sign of prosperity, but of inefficiency.

https://passipedia.org/efficiency_now/the_big_picture

Energy Efficiency - The big picture [Passipedia EN]

@DewiLeBars There are some really huge state-to-state differences in the US as well. California is at 9.3 tons of CO2e per capita (counting all greenhouse gases) which is probably fairly similar to that in Europe.

The big difference is that the state has mandatory energy efficiency rules for buildings (title 24) and appliances.

Graph from https://ww2.arb.ca.gov/sites/default/files/classic/cc/inventory/2000-2020_ghg_inventory_trends.pdf#page=6

@DewiLeBars
I was about to ask why there was a big dip in Europe in 1941 or 1942 🤦‍♀️
@efraim sudden rise in environmental consciousness? 😉