Today is the publication day of The Birth of Computer Vision, my latest book. It is published by the University of Minnesota.
https://www.upress.umn.edu/book-division/books/the-birth-of-computer-vision
The Birth of Computer Vision
A revealing genealogy of image-recognition techniques and technologies
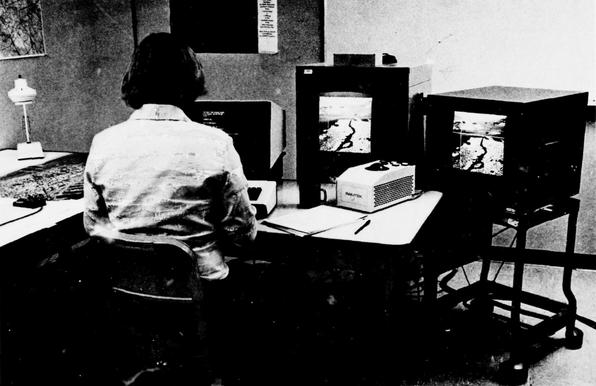
The cover of the book features the HAWKEYE workstation--an important project in the history of computer vision. It is one of the last moments that I write about. This is the “SRI road expert system” that marked the (temporary) turn to rule-based expert systems.
The history of computer vision and machine learning are impossible to separate as these technologies were understood to require each other, from the late 1950s to now.
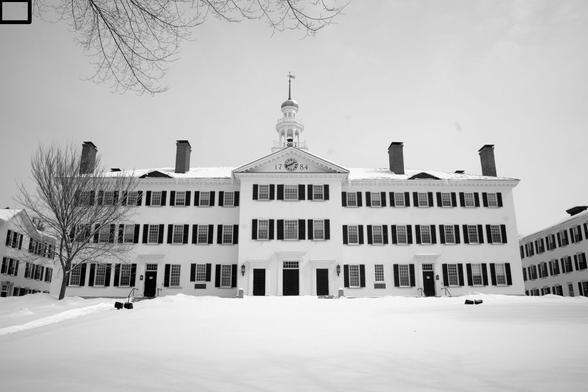
I use several images of my own institution, beginning with a picture of Dartmouth Hall. This was the building that housed the famous “Dartmouth Summer Research Project on Artificial Intelligence” in 1956.
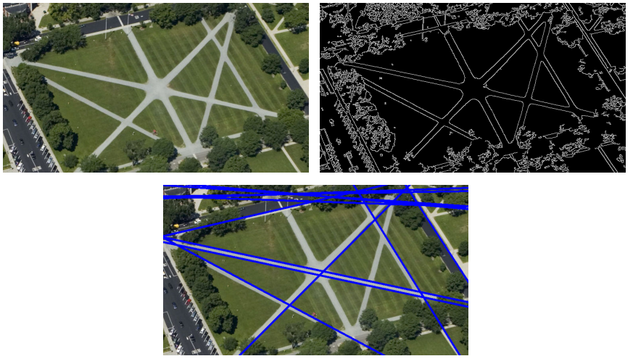
An aerial photograph of the Dartmouth Green was also useful to demonstrate Hough line detection, an important algorithm originating in the Shakey Project.
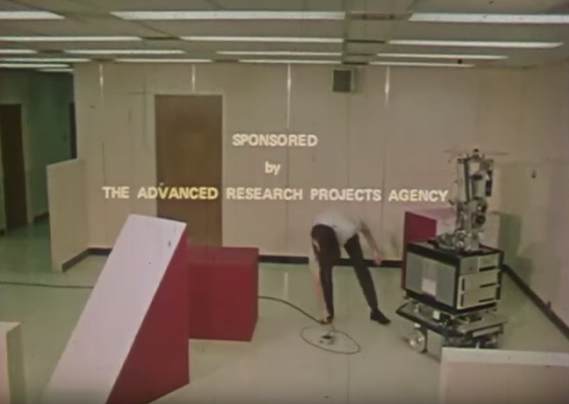
Shakey was a project funded by ARPA to build “automatons capable of gathering, processing, and transmitting information in a hostile environment”—an obvious oversell for anyone watching the promo video.
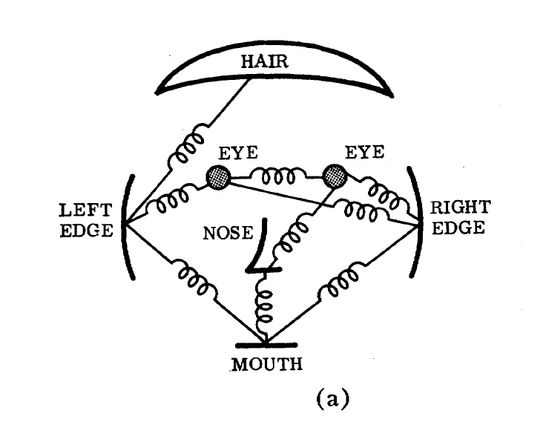
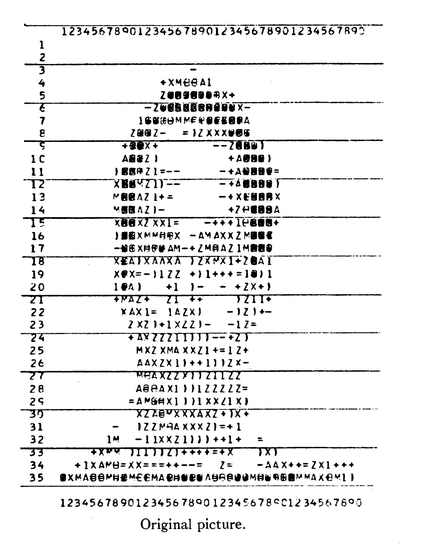
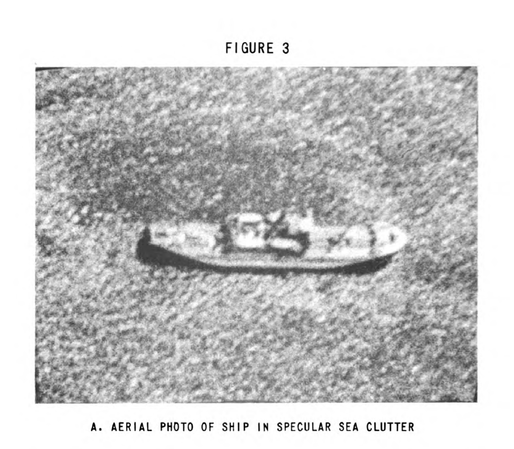
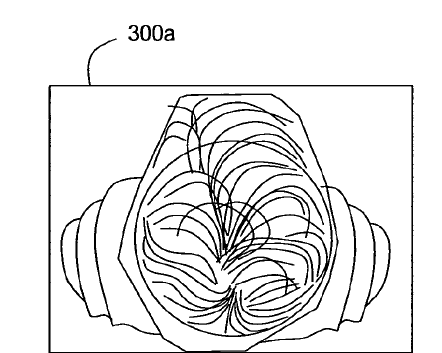
I also especially interested in the development of face detection algorithms. Present-day systems are directly descended from “pictorial structures” of the early 1970s. These topographical structures treated both faces and aerial photography.
The symbolic representation of faces was rather simple in the early 1970s.
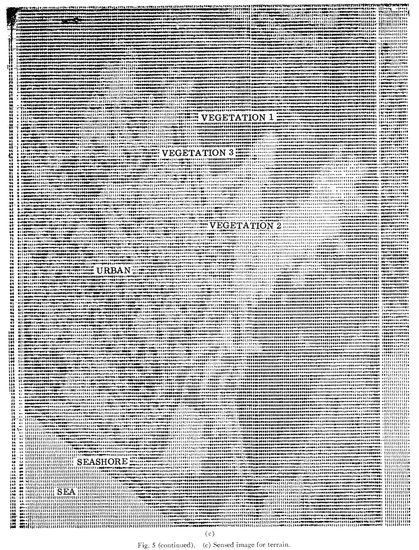
What I called a digital agent orange was proposed to use these same technologies to map spaces for the US military in Vietnam.
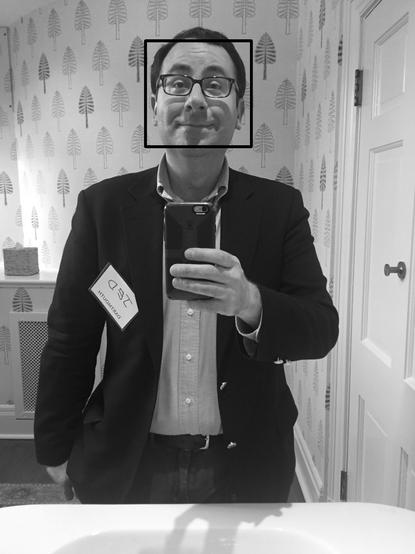
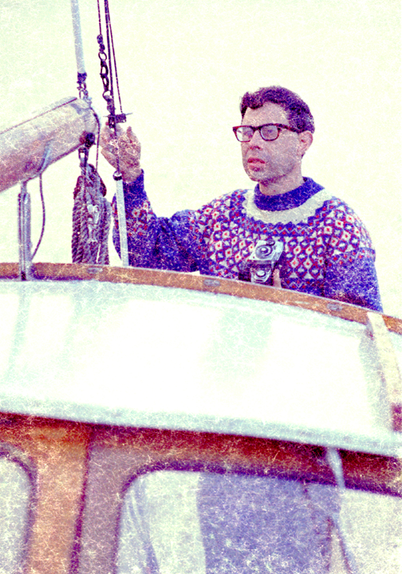
Speaking of face detection and Dartmouth, here’s a bathroom selfie of me in the Dartmouth President’s House with a bounding box around my face.
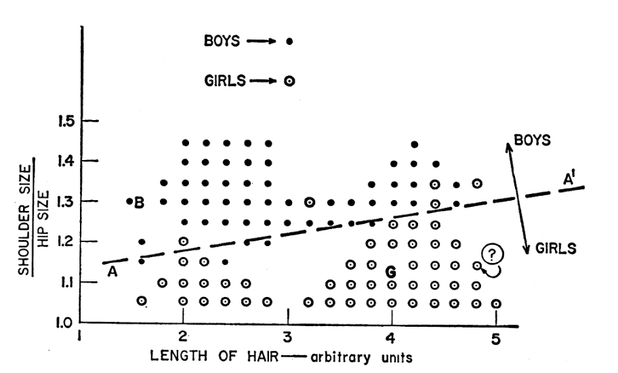
1960s ideology saturated early ML and computer vision. Gender difference appeared in strange places. Charles A. Rosen, key member of the Shakey Project, used this to chart to explain feature selection and classification.