What is happening... I need a table to figure this chart!

#ChartCrimes #DataViz #BadViz

@helenajambor @HeidiSeibold Take off and nuke it from orbit. It's the only way to be sure.
@helenajambor is it trying to annotate the multiplicative ("X") change between some pairs of bars of similar colours?
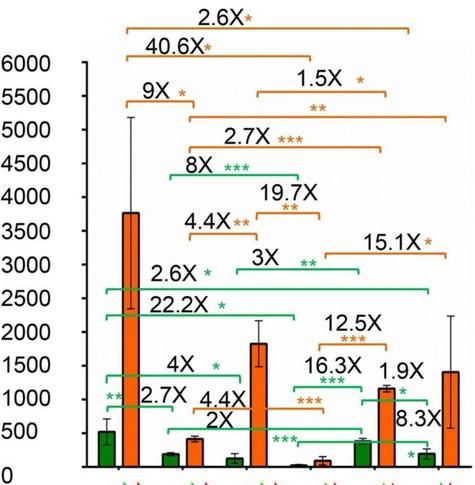
@helenajambor ah, and the stars are showing these are the "significant" changes according to some model? Which explains why not all bar pairs are annotated?
@geospacedman I should think so, but who can be sure here. Also, the colors are not matched, yellow refers to orange bars, light green to dark green bars...
@helenajambor they're the same basic hue. I'm trying to think how all this could be presented better though and my conclusion is... a table!
@helenajambor I didn’t think it was possible to make a visualisation this confusing! #BadViz