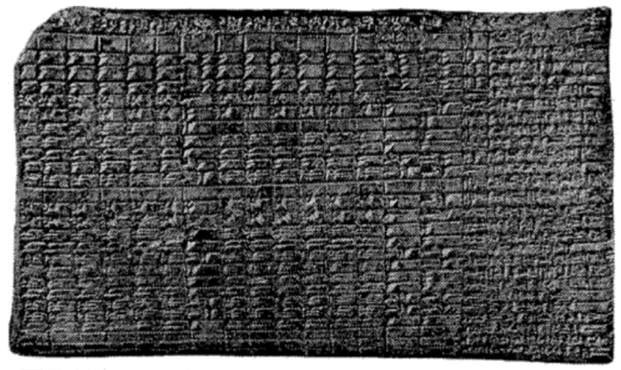
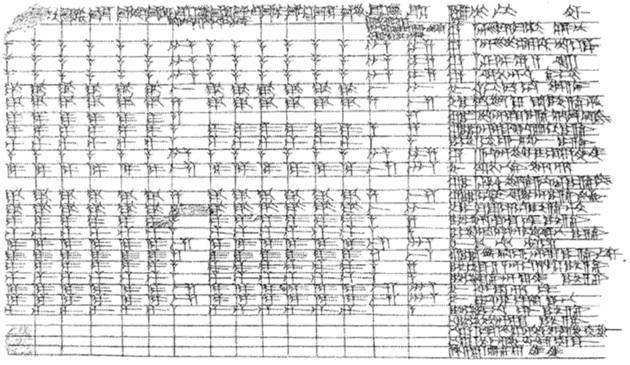
I've been collecting interesting examples of information organisation in history, focusing on non-Western civilisations. I came across this example of an ancient Mesopotamian spreadsheet! It records wages paid to temple workers in 1295 BCE.

#History #AncientHistory #Cuneiform #Mesopotamia #CognitiveHistory

@michelleful Where is this from? I'm curious how much it actually uses rows/columns in a spreadsheety way.

@benmschmidt I unhelpfully tucked the citation in the alt-text. Here it is:

Robson, E. (2003). Tables and tabular formatting in Sumer, Babylonia, and Assyria, 2500 BCE-50 CE. In Campbell-Kelly, M. et al (eds.) The history of mathematical tables: From Sumer to spreadsheets, OUP. 19-47

Direct link: https://books.google.com/books?hl=en&lr=&id=ihRREAAAQBAJ&oi=fnd&pg=PA19&dq=organization+of+the+babylonian+archives&ots=fOlLoQVz86&sig=7hjiZeIzLeQj51rp9Yr7CZ9X5jI#v=onepage&q=organization%20of%20the%20babylonian%20archives&f=false

They did have sub-totals and totals but not in both directions in this example, if I'm understanding this right. Also, the table continues on the other side of the tablet.

The History of Mathematical Tables

The oldest known mathematical table was found in the ancient Sumerian city of Shuruppag in southern Iraq. Since then, tables have been an important feature of mathematical activity; table making and printed tabular matter are important precursors to modern computing and information processing. This book contains a series of articles summarising the technical, institutional and intellectual history of mathematical tables from earliest times until the late twentieth century. It covers mathematical tables (the most important computing aid for several hundred years until the 1960s), data tables (eg. Census tables), professional tables (eg. insurance tables), and spreadsheets - the most recent tabular innovation. The book is presented in a scholarly yet accessible way, making appropriate use of text boxes and illustrations. Each chapter has a frontispiece featuring a table along with a small illustration of the source where the table was first displayed. Most chapters have sidebars telling a short "story" or history relating to the chapter. The aim of this edited volume is to capture the history of tables through eleven chapters written by subject specialists. The contributors describe the various information processing techniques and artefacts whose unifying concept is "the mathematical table".

Google Books
@michelleful Thanks so much, really interesting. I had a lecture unit I used to give a lot that included the Bedolina map, this would have gone great in it.

@benmschmidt Oh very cool, what class was it for, and are the slides or handouts available anywhere?

I hadn't actually seen the Bedolina map before, it is gorgeous and fascinating! Maps and diagrams are two of the "technologies" on my radar for researching but I'm not sure how to draw the line between a pictorial representation and a more abstract diagram.

@michelleful note the inherent L to R reading of the table by calling the names column the "final column". The layout suggests to me they were going R to L in filling it out?
@browneyedgirl I believe by this point Sumerian was written left-to-right so I get where they were coming from in calling it the "final" column. It would be interesting to compare with other tables from the period to see if they all have what we could consider the "start" column on the right.
@michelleful weird bc new info is going in in the left
@browneyedgirl oh good point, the order of the months is a thing.