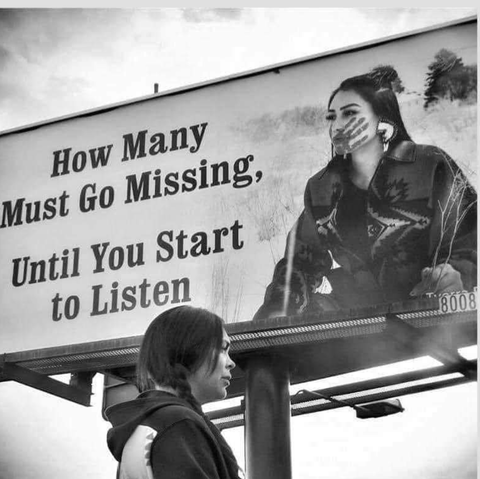
Cool sign.
What is the background story?
Cool sign.
What is the background story?
Thank you.
I had not been aware of this tragedy, #NoMoreStolenSisters.
https://www.nativehope.org/missing-and-murdered-indigenous-women-mmiw
This seems to be a commonality with one of the largest minority, #blacks:
"Despite representing 12.85% of the population, black Americans accounted for nearly 226,000 — or 34% — of all missing persons reported in 2012."
Idk the pecentage of #NativeAmericans in the #US and #Canada, but for the #US it is 1.1% in comparison, 3.684.982 people...
2/n
...(as of April, 2020; https://www.indexmundi.com/united_states/demographics_profile.html).
The #CIA's estimate for the #US population in 2022 is 337341954, 1.1% of which would be 3.7m people.
Of the 38,232,593 people estimated to live in #Canada in 2022, about 4.4% identified as #NativeAmericans, about 1.7 m people. (https://www.cia.gov/the-world-factbook/countries/canada/summaries)
So, this adds up to ca. 5.4m #NativeAmericans. The sex ratio for the #US population is 0.97. I will assume this is about the same for CAN and...
@anna_lillith
3/n
...and the #US and that therefore the age distribution of #NativeAmericans is not too different. So 50.52% of 5.4m = 2.7m #NativeAmerican women. So 5.712 (2016) missing females means 212 missing for every 100, 000 people.
According to #NamUS "...Nationwide, there are roughly 6.5 missing persons for every 100,000 people."
(https://worldpopulationreview.com/state-rankings/missing-persons-by-state)
This would mean that the disappearance of...
4/5
...female #NativeAmericans in #NorthAmerica is THIRTY-TWO times higher than the #US average.
(If I made a mistake somewhere, let me know. I should not have written this on a smartphone.)
Note:
I did not include #PacificIslanders and #Hawaiians, a further 0.2% of the #US population, as they did not seem to be included in the 5.712.
It would have been better to use 2022 data for the missing females, too.
Particularly in Canada, people could name more than one...
5/5
...ethnicity in the census, so the denominator might be slightly higher, which would slightly increase the ratio for the #Canadian segment of the figures.
Further investigation seems warranted, if my calculations are correct.
This cannot be a sociological deviation, as possibly with the figures for #blacks in 1/n.
BTW, #NamUS seems to have noticed, too. The only special report for ethnicities is for #AmerIndians and #AlaskanNatives:
https://namus.nij.ojp.gov/sites/g/files/xyckuh336/files/media/document/namus-stats-ai-an-october-2022.pdf.


