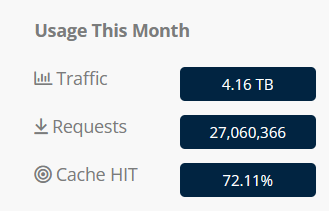
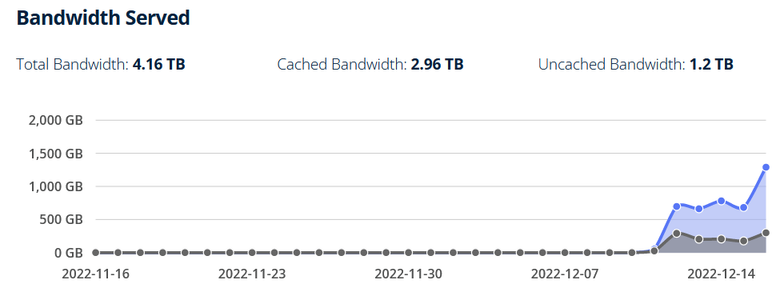
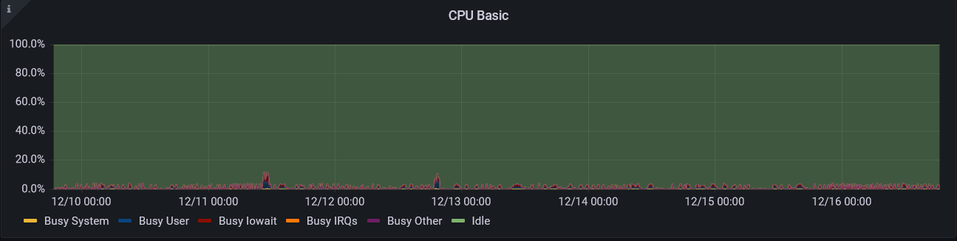
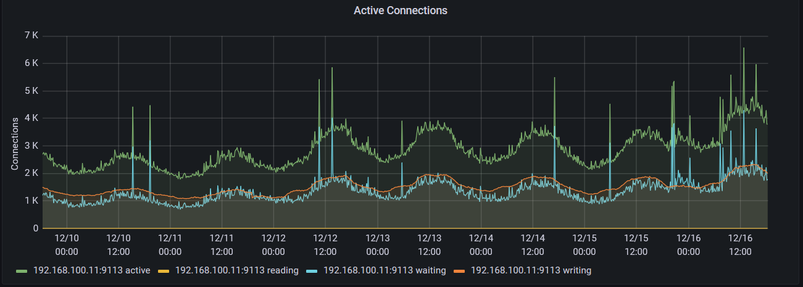
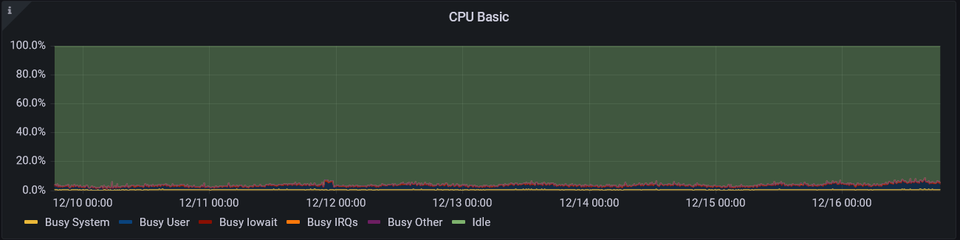
Now at 1700 new accounts on the day @infosec.exchange. This is what it looks like on the load balancer:
And this is what's happening at the CDN:
And this is what the aggregate CPU on the PUMA servers look like (note, almost no change)
And this is the aggregate load on the sidekiq servers (also, nearly no change)
Transaction growth on the postgresql database:
CPU on the redis/elasticsearch server. I can barely find it:
final graph (I don't have much else that would be interesting) is the sidekiq graph:
I lied. One more. I feel bad that I am just now realizing I didn't tell Prometheus to monitor the load balancer, so here is a snapshot of nmon from the load balancer:

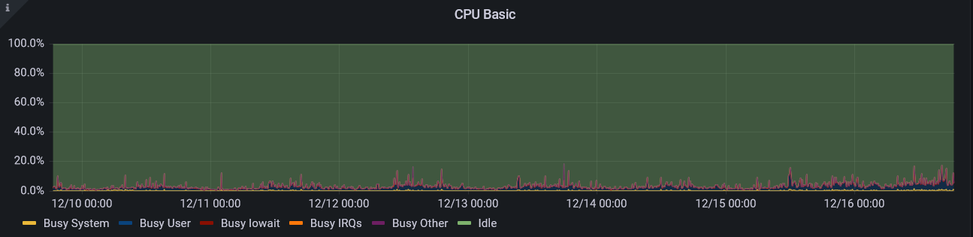
@jerry kinda surprised you dont have a giant linux terminal with:
- htop
- nload
- iftop
- atop
- ioping

and prolly asciiquarium and cmatrix for good measure :D

Glances - An Eye on your system

Glances is a cross-platform curses-based system monitoring tool written in Python.

@pixelnull @Viss oh that looks amazing

@jerry @Viss it has a package avail for most distros.

i wouldn't do a github or pip install for it, they can get a little experimental with releases in my exp

@pixelnull @jerry oh yes! glances! i always forget about glances. You need a big terminal for it tho
@Viss @pixelnull I have two 43" monitors 🎉​
@jerry @Viss @pixelnull NICE! You got a mini-NOC there 😎