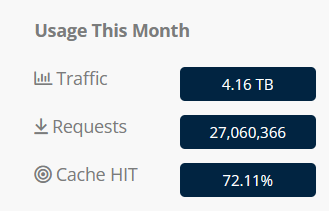
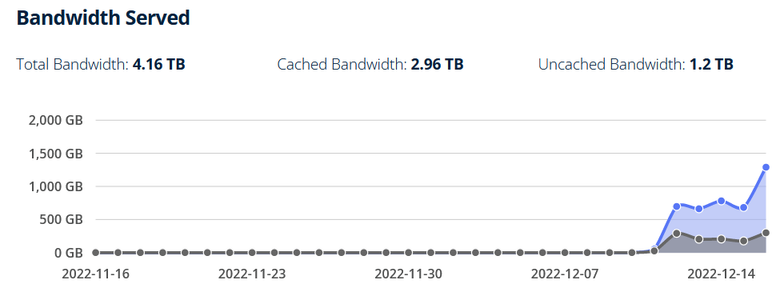
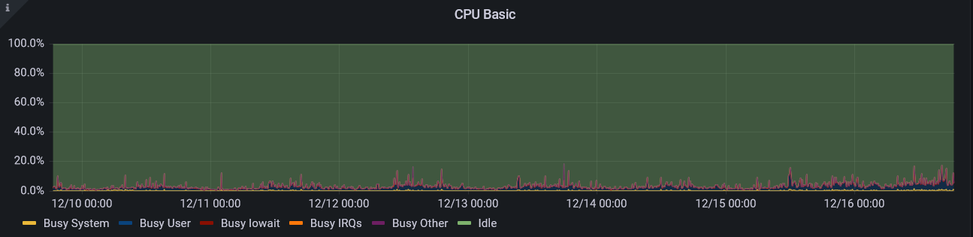
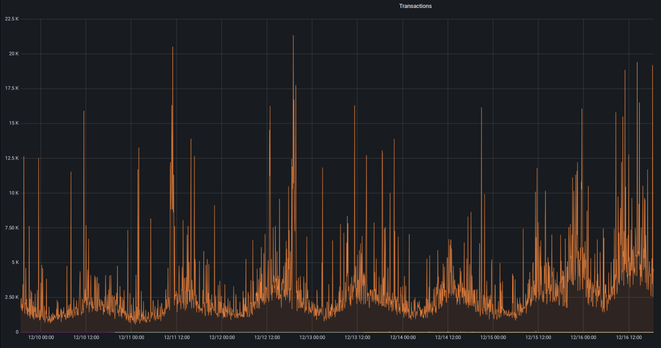
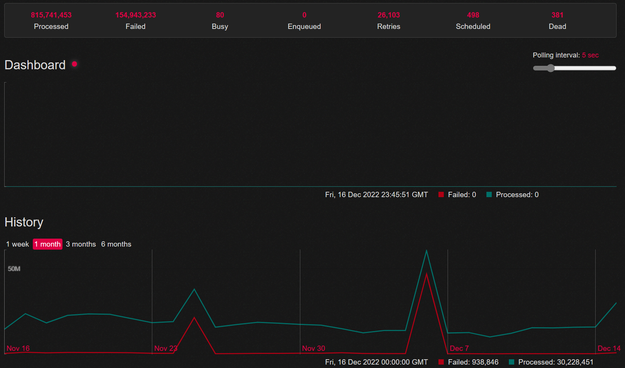
Now at 1700 new accounts on the day @infosec.exchange. This is what it looks like on the load balancer:
And this is what's happening at the CDN:
And this is what the aggregate CPU on the PUMA servers look like (note, almost no change)
And this is the aggregate load on the sidekiq servers (also, nearly no change)
Transaction growth on the postgresql database:
CPU on the redis/elasticsearch server. I can barely find it:
final graph (I don't have much else that would be interesting) is the sidekiq graph:
I lied. One more. I feel bad that I am just now realizing I didn't tell Prometheus to monitor the load balancer, so here is a snapshot of nmon from the load balancer:

@jerry kinda surprised you dont have a giant linux terminal with:
- htop
- nload
- iftop
- atop
- ioping

and prolly asciiquarium and cmatrix for good measure :D

@Viss @jerry +1 for cmatrix

@travelingflwr @jerry and screenfetch if you're feeling snazzy. there are a couple more i know im forgetting that add to the 'hacker-looking cool factor'.

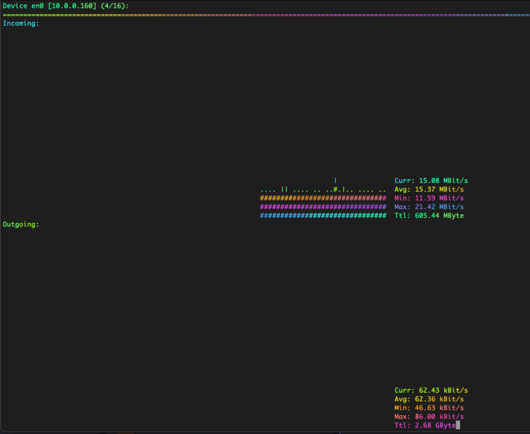
cheatcode-mode is to pipe some dumb shit through lolcat, cuz it looks like this: