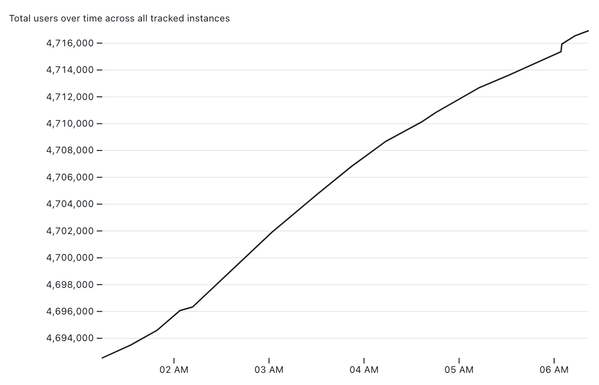
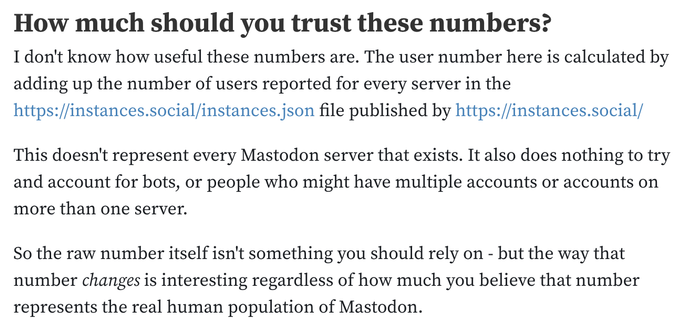
I put together my own system for tracking the total number of Mastodon users over time, as reported for the instances tracked by https://instances.social/

It's a delightful (to me) combination of different tricks - git scraping, my git-history and s3-credentials tools, Datasette Lite and an Observable notebook to plot the chart at the end.

I describe how it all works in detail here: https://simonwillison.net/2022/Nov/20/tracking-mastodon/

Or you can jump straight in to play with my notebook: https://observablehq.com/@simonw/mastodon-users-and-statuses-over-time

Mastodon instances

This is a good example of me forcing myself to live the "If you do a project, you should write about it" rule - I was SO tempted to get this thing working and then go to bed, but I made myself do the extra 45 minutes of work to turn it into a blog post.

https://simonwillison.net/2022/Nov/6/what-to-blog-about/

What to blog about

You should start a blog. Having your own little corner of the internet is good for the soul! But what should you write about? It’s easy to get hung up …

Added a disclaimer to the notebook at https://observablehq.com/@simonw/mastodon-users-and-statuses-over-time - just in case people start taking those numbers as the gospel truth as to the human population of Mastodon
Mastodon users and statuses over time

Gathered by scraping the JSON from https://instances.social/ every 20 minutes using this repository: https://github.com/simonw/scrape-instances-social For full details about how this works, see Tracking Mastodon user numbers over time with a bucket of tricks on my blog. How much should you trust these numbers? The user number here is calculated by adding up the number of registered users reported for every server in the https://instances.social/instances.json file published by https://instances.social/ This

Observable

Had a couple of complaints that my chart is misleading because it doesn't start the x axis from zero

I don't see that myself - I was VERY careful to make the x axis values as prominent as possible to avoid any potential for confusion there

But since people asked, I've added a from-zero chart to the notebook too

https://observablehq.com/@simonw/mastodon-users-and-statuses-over-time

Unsurprisingly it's not very interesting - it's effectively a horizontal line at ~4.7m!

Mastodon users and statuses over time

Gathered by scraping the JSON from https://instances.social/ every 20 minutes using this repository: https://github.com/simonw/scrape-instances-social For full details about how this works, see Tracking Mastodon user numbers over time with a bucket of tricks on my blog. How much should you trust these numbers? The user number here is calculated by adding up the number of registered users reported for every server in the https://instances.social/instances.json file published by https://instances.social/ This

Observable
If you have ideas for better ways to present the data I've collected (I'm certain there's huge room for improvement here) you can fork my notebook on Observable and try them out!

After struggling for a while to figure out the best way to add a "new users per hour" chart I spotted there was an incoming change suggestion implementing exactly that... from Observable/D3 author Mike Bostock!

So that's now available in the notebook too: https://observablehq.com/@simonw/mastodon-users-and-statuses-over-time

Mastodon users and statuses over time

Gathered by scraping the JSON from https://instances.social/ every 20 minutes using this repository: https://github.com/simonw/scrape-instances-social For full details about how this works, see Tracking Mastodon user numbers over time with a bucket of tricks on my blog. How much should you trust these numbers? The user number here is calculated by adding up the number of registered users reported for every server in the https://instances.social/instances.json file published by https://instances.social/ This

Observable

Some spam instances just showed up with fake user numbers that completely broke my charts (leaping the number of users from ~4.5m to 80m+)

Issue about that here - I'll fix my pipeline to avoid these in the morning https://github.com/simonw/scrape-instances-social/issues/4

Ignore angelfire glitch instances · Issue #4 · simonw/scrape-instances-social

https://lite.datasette.io/?json=https%3A%2F%2Fraw.githubusercontent.com%2Fsimonw%2Fscrape-instances-social%2Fmain%2Finstances.json#/data/instances?_filter_column=&_filter_op=exact&_filter_v...

GitHub

One of the neat things about Git scraping is that everything on GitHub is served with open CORS headers, which means JS apps can load that data even if the original source didn't enable CORS

So here's a Datasette Lite link for exploring the instances.json data from https://instances.social/ as an interactive table!

https://lite.datasette.io/?json=https%3A%2F%2Fraw.githubusercontent.com%2Fsimonw%2Fscrape-instances-social%2Fmain%2Finstances.json#/data/instances?_sort=users&_sort_by_desc=on

Mastodon instances

@simon oh shit I am really grokking how you've made datasette even more web than it already was

@anildash Datasette Lite really was mostly meant to be an elaborate joke - running a server-side web app entirely in the browser - but it's fast becoming one of my favourite pieces of the whole ecosystem

Turns out a 12MB loading weight in 2022 (to load in a full copy of Python compiled to WebAssembly) isn't nearly as prohibitive as I had expected!