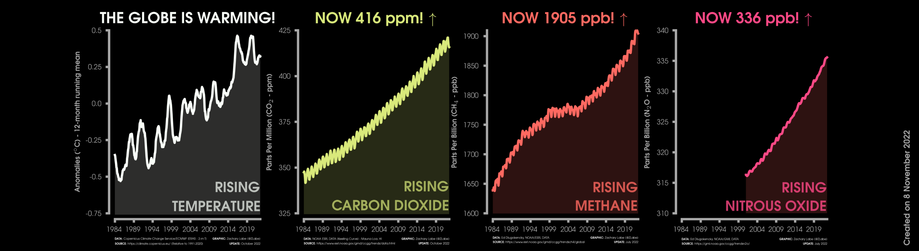
Example of four graphs showing more data points of what is happening around us. #COP27
Your monthly #climatechange update.
+ Data from https://gml.noaa.gov/ccgg/
+ Graphic from https://zacklabe.com/climate-change-indicators/
Example of four graphs showing more data points of what is happening around us. #COP27
Your monthly #climatechange update.
+ Data from https://gml.noaa.gov/ccgg/
+ Graphic from https://zacklabe.com/climate-change-indicators/