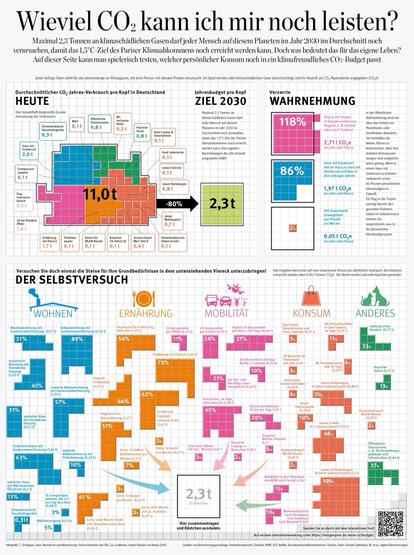
@florin This is a great #visualization. The recent #IPCC report by WGIII identifies 60 actions (see figure) to change individual consumption and mobility choices with largest potential to reduce our carbon footprint.
I wrote a thread on twitter on this early this year:
https://twitter.com/ilitat/status/1512757142540931074?s=20&t=o8WHpw2bdgrIala9gPEijg
“About 2/3 of global GHG emissions are associated with household consumption. Shifting our individual consumption patterns to low-carbon alternatives is prerequisite for emission reductions. So, what can each of us do to broaden own participation in climate action? 1/n”
About 2/3 of global #GHG emissions are associated with #household #consumption.
Shifting our individual consumption patterns to low-#carbon alternatives is prerequisite for #emission reductions.
Each of us can do a lot to broaden own participation in #climate action!
India and United Nations launch environmental lifestyle program ‘Mission Life
The post I am replying to has a great figure showing the potential impact (box-and-whisker plots) on #CO2 emissions of a variety of demand-side household activities.
There are three groups of activities: avoid (e.g., less driving, less paper use), improve (e.g., heat pump, recycle), and shift (e.g., to public transport, to organic foods). The plots include a region where CO2 emissions are reduced, and a region where CO2 emissions may actually increase due to the behavior (rebound effect).