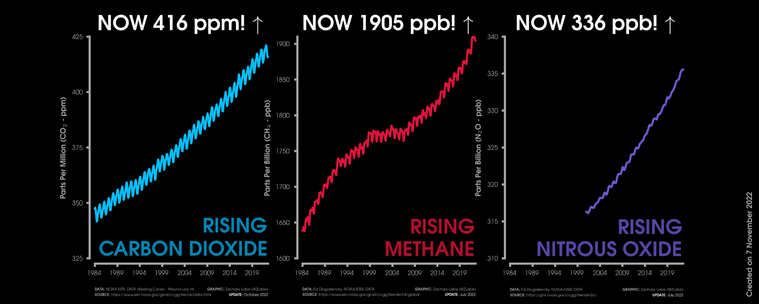
A broken record - sorry, another month of my graph showing increases in greenhouse gas observations 🥺
+ Data available from https://gml.noaa.gov/ccgg/
+ More graphs at https://zacklabe.com/climate-change-indicators/
A broken record - sorry, another month of my graph showing increases in greenhouse gas observations 🥺
+ Data available from https://gml.noaa.gov/ccgg/
+ More graphs at https://zacklabe.com/climate-change-indicators/
@ZLabe Your visualization of climate change data is so clear to my teen students. 😟 (We start off the week with Data Monday, and they’re currently working through a polar ice chem storyline unit.) They have many excellent scientific wonderings, but the social justice theme is usually something like, “Why isn’t this more apparent to leaders?” “Why isn’t this on billboards?” “Why don’t we hear about this?”