Tableau vs Power BI vs Excel: Which Tool Should You Learn in 2026?
Start your BI career with Tableau Classes in Delhi offering practical learning, live projects, and advanced reporting techniques.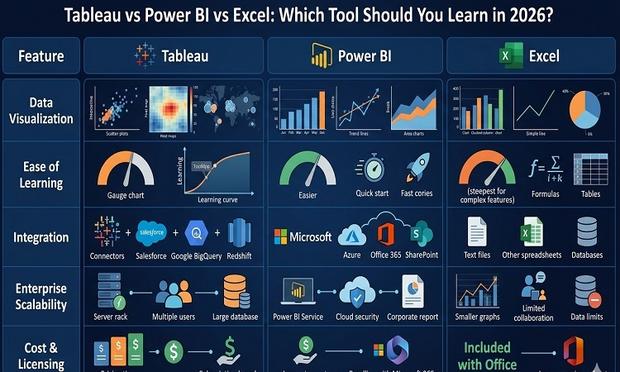
Tableau vs Power BI vs Excel: Which Tool Should You Learn in 2026?
Start your BI career with Tableau Classes in Delhi offering practical learning, live projects, and advanced reporting techniques.What is Tableau? A Complete Beginner’s Guide (2026)
Tableau is an easy-to-use tool that enables one to visualize data by creating simple tables, graphs, and dashboards. It is widely adopted by firms to interpret data faster and make sound judgments. The software does not require any technical skills, hence anyone can master it without writing code. By 2026, Tableau will continue to be among the top data visualization platforms. Key Facts About Tableau Simple to learn and use Converts data into visuals instantly Used in jobs such as data […]https://quickdials.wordpress.com/2026/04/18/what-is-tableau-a-complete-beginners-guide/

Tableau | What is Tableau | Tableau Course | Intellipaat #Shorts #Tableau
Tableau #WhatisTableau #TableauCourse #TableauForBeginners #TableauTraining #Learning #Shorts #ShortsVideo #Trending ... source
https://quadexcel.com/wp/tableau-what-is-tableau-tableau-course-intellipaat-shorts-tableau/
Live | Master Tableau Course Live Session | Advanced Concepts Explained | GoLogica Training
Live | Master Tableau Course Live Session | Advanced Concepts Explained | GoLogica Training #live #tableaucourse ... source
Tableau Mastery in 5 Hours FAST TRACK Your Career!
tableau #tableaututorial #tableaudesktop #tableauclasses #tableauvisualization #tableaufullcourse #tableaucourse ... source
https://quadexcel.com/wp/tableau-mastery-in-5-hours-fast-track-your-career/
Tableau course fees
Affordable and Worth It!" - Henry Harvin's Tableau course fees are surprisingly reasonable considering the quality of their training. Definitely recommend

Atul Sharma's answer: What is Tableau ? Tableau was founded in 2003 as a result of a computer science project at Stanford that aimed to improve the flow of analysis and make data more accessible to people through visualization. This includes making machine learning, statistics, natural language...

